ScanX Analyzes Point Clouds in the Cloud with Cesium
Point cloud processing has traditionally required high-performance computers and extensive human involvement. Locus Blue, a Cesium Certified Developer based in Japan, created ScanX to automate point cloud data segmentation and make visualization accessible on the web. ScanX is a browser-based platform using CesiumJS to provide access to massive datasets, enable timely analysis, and reduce reliance on specialized equipment.
ScanX improves operational efficiency. Courtesy Locus Blue.
ScanX, released in 2020, has processed more than 10,000 datasets in Cesium for construction companies, municipalities and first responders, foresters, and insurance companies, among others. It has users in 43 of Japan’s 47 states, with plans to make its SaaS platform available globally. Japanese city governments, as well as the national government, are building 3D models of their country to enable collaboration across industries, visualize crowded areas, and encourage public input on development.
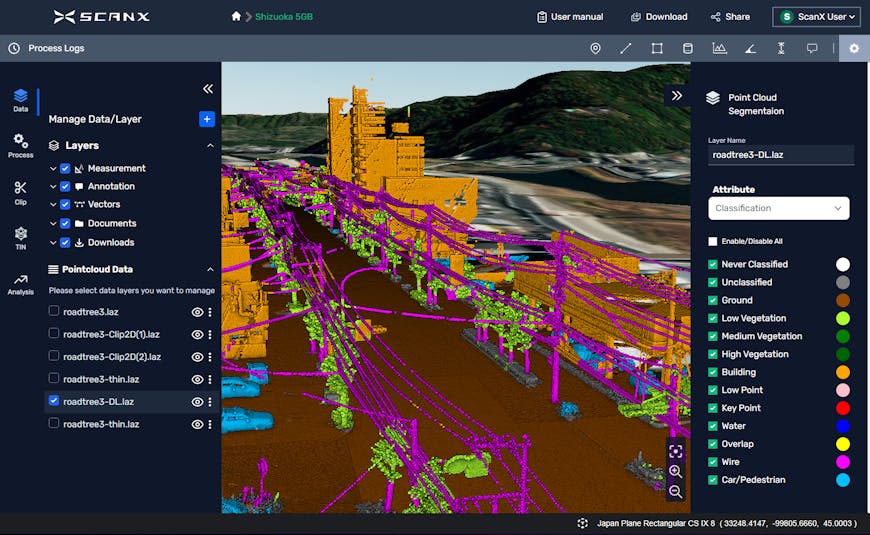
Data classifications in Shizuoka, Japan. This image uses data from Virtual Shizuoka, Shizuoka Prefecture, Mt. Fuji, and Eastern Shizuoka and is licensed under CC 4.0/ODbL. Courtesy Locus Blue.
ScanX’s users acquire their data from terrestrial laser scanners (TLS) and lidar scans by drones, UAVs, and even iPhones. They drag and drop these datasets into ScanX’s uploader, where the datasets are automatically segmented into the different point classifications using ScanX’s deep learning algorithms. ScanX processes mostly point clouds but also commonly handles glTF, OBJ, and 2D files such as floor plans. These files are hosted in Cesium ion, where they are tiled into 3D Tiles and streamed to Cesium ion SDK. Cesium ion SDK extends the open-source CesiumJS JavaScript library with additional 3D analysis tools and UI widgets. Like CesiumJS, it was designed for precision, interoperability, and accessibility. ScanX also accesses Bing Maps Aerial imagery and Cesium World Terrain through Cesium ion, providing accurate geospatial context for the users’ data.
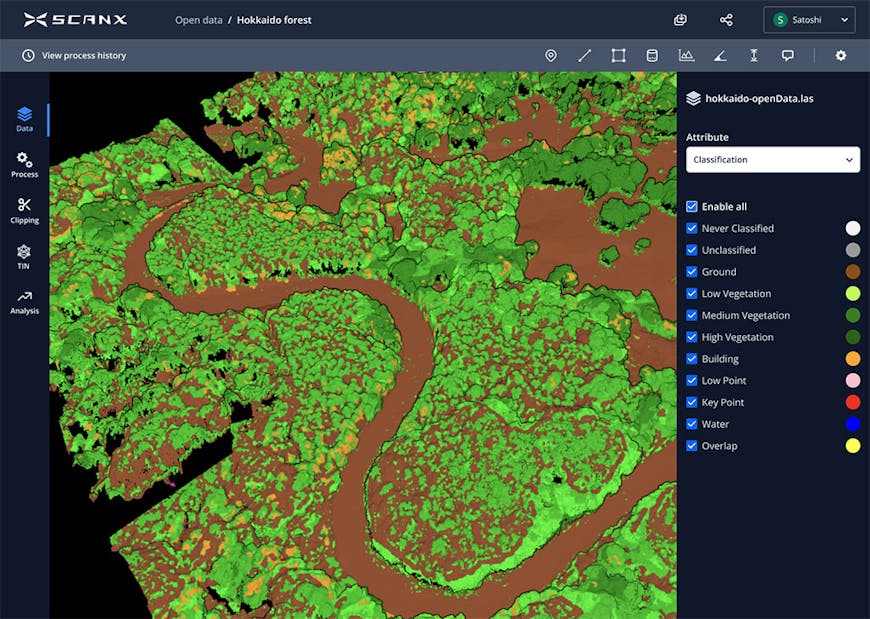
Data classifications of a forest area on Hokkaido, Japan’s northernmost island. Courtesy Locus Blue.
The advanced machine learning algorithms behind ScanX remove noise in the point clouds and automatically segment the data to highlight waterways, land, vegetation, buildings, wires, and other classifications, so users get the information they need quickly.
With a single URL, entire dashboards and data-derived intelligence can be shared within organizations and across outside collaborators, enabling smooth teamwork and timely action. Insurance companies and aid organizations, for example, can detect hazards and damage after natural disasters; municipalities can manage smart city projects and infrastructure maintenance; construction companies can monitor progress; and foresters can count and measure trees and estimate carbon data.
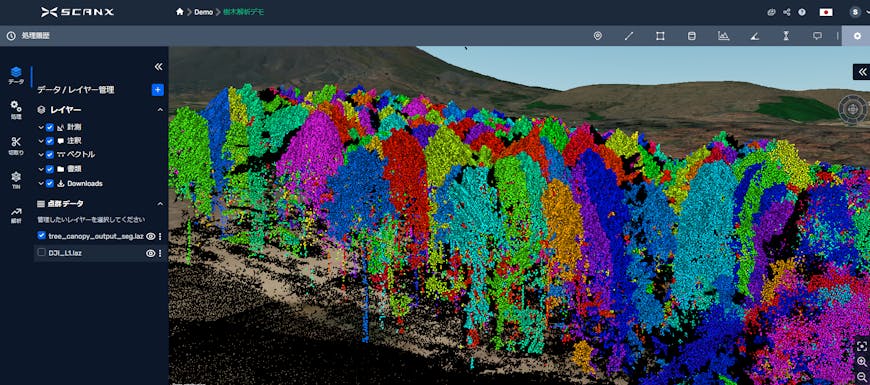
Canopy segmentation, helpful for forest management. Courtesy Locus Blue.
ScanX plans to add more objects to be segmented, increase tools for change detection, and support heat maps.
Sign up for a free Cesium ion account and take your massive datasets anywhere.