Working with Cesium World Bathymetry in CesiumJS
Last week we released Cesium World Bathymetry, a new global tileset that enables you to build applications that visualize underwater environments like ocean floors, along coastlines, or inland bodies of water. This post will describe a few best practices to enhance the visualization of bathymetric terrain using CesiumJS such as lighting, contour lines, and depth shading.
The code examples below are drawn from this complete Sandcastle example. Features shown in the example are broken down in more detail below.
First, connect to Cesium ion then set Cesium World Bathymetry to be your terrain provider.
const viewer = new Cesium.Viewer("cesiumContainer", {
  terrainProvider: await Cesium.CesiumTerrainProvider.fromIonAssetId(
    2426648
  ),
  timeline: false,
  animation: false,
});
Lighting a scene makes it easier to see the contours of 3D terrain. While the satellite imagery typically displayed on terrain already has light and shadows when captured, imagery of water is usually not as well lit. Using CesiumJS’s lighting options brings attention to the peaks and valleys making it easier to understand topography.
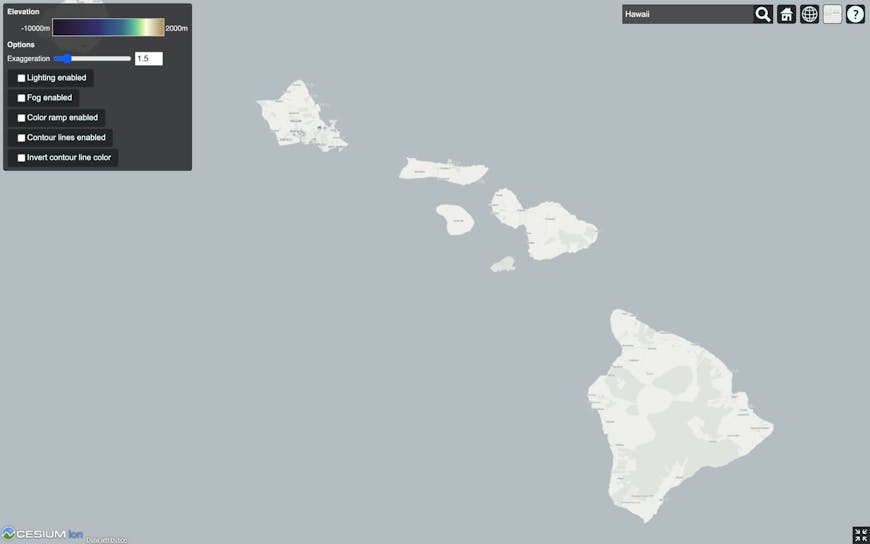
Cesium World Bathymetry of Hawaii with no lighting
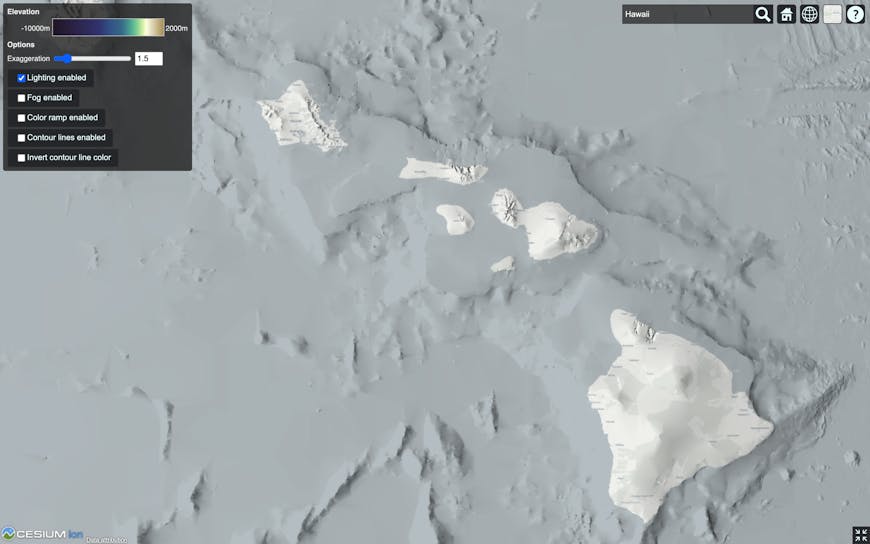
Cesium World Bathymetry of Hawaii with lighting
Since the terrain geometry is brought into focus, in the examples to follow, the global maximumScreenSpaceError is decreased from the default so that higher detail is loaded sooner.
Atmosphere and fog are visualization functions that are useful for land, but not bathymetry. Atmosphere includes a combination of lighting and color effects that make the Earth and sky appear more realistic, helping viewers intuit distance and time of day.
Fog blends the atmosphere to geometry far from the camera for horizon views. This creates a more realistic appearance and also assists with performance. However, both atmosphere and fog can make changes in bathymetric elevation difficult to perceive.
The following sample code is used to turn on lighting and turn off atmosphere and fog. Using Cesium.DirectionalLight, we also apply a hillside lighting effect to show the relief on slopes that are otherwise often uniform in appearance. Since the lighting calculations require the object’s vertex normals, make sure to include `{ requestVertexNormals: true }` when requesting the terrain.
const viewer = new Cesium.Viewer("cesiumContainer", {
  terrainProvider: await Cesium.CesiumTerrainProvider.fromIonAssetId(
    2426648,
    { requestVertexNormals: true }
  ),
});

const scene = viewer.scene;
const globe = scene.globe;
const camera = scene.camera;

scene.fog.enabled = false;
globe.showGroundAtmosphere = false;

globe.enableLighting = true;

scene.light = new Cesium.DirectionalLight({
  direction: new Cesium.Cartesian3(1, 0, 0), // Updated every frame
});

// Update the light direction every frame to match the current camera view
const scratchNormal = new Cesium.Cartesian3();
scene.preRender.addEventListener(function (scene, time) {
  const surfaceNormal = globe.ellipsoid.geodeticSurfaceNormal(
    camera.positionWC,
    scratchNormal
  );
  const negativeNormal = Cesium.Cartesian3.negate(
    surfaceNormal,
    surfaceNormal
  );
  scene.light.direction = Cesium.Cartesian3.normalize(
    Cesium.Cartesian3.add(
      negativeNormal,
      camera.rightWC,
      surfaceNormal
    ),
    scene.light.direction
  );
});

globe.maximumScreenSpaceError = 1.0; // Load higher resolution tiles for better seafloor shading
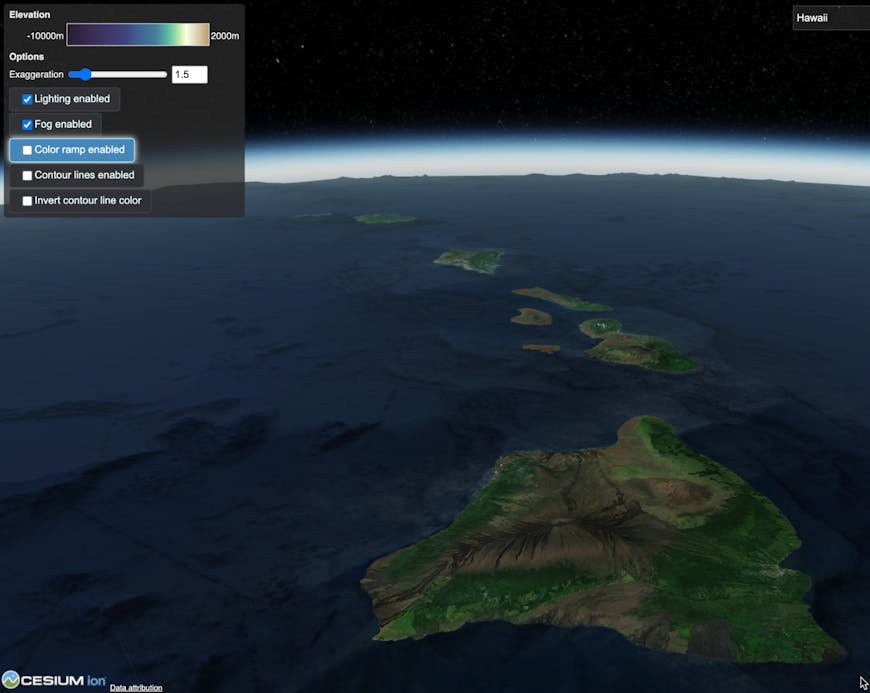
Horizon view of Cesium World Bathymetry of Hawaii with fog
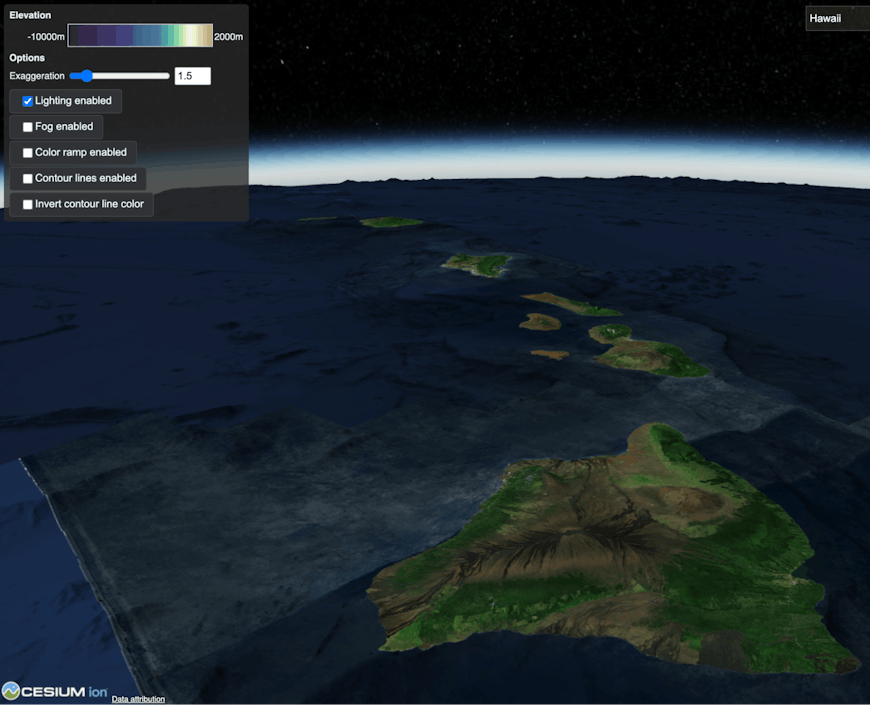
Horizon view of Cesium World Bathymetry of Hawaii with no fog
Bing Aerial Imagery is the default imagery provider in CesiumJS, which can be dark, especially in bodies of water. This makes bathymetry more difficult to see due to lack of contrast. Sentinel-2 imagery, also available as part of Cesium ion, is lighter, which can often better showcase terrain data in oceans.
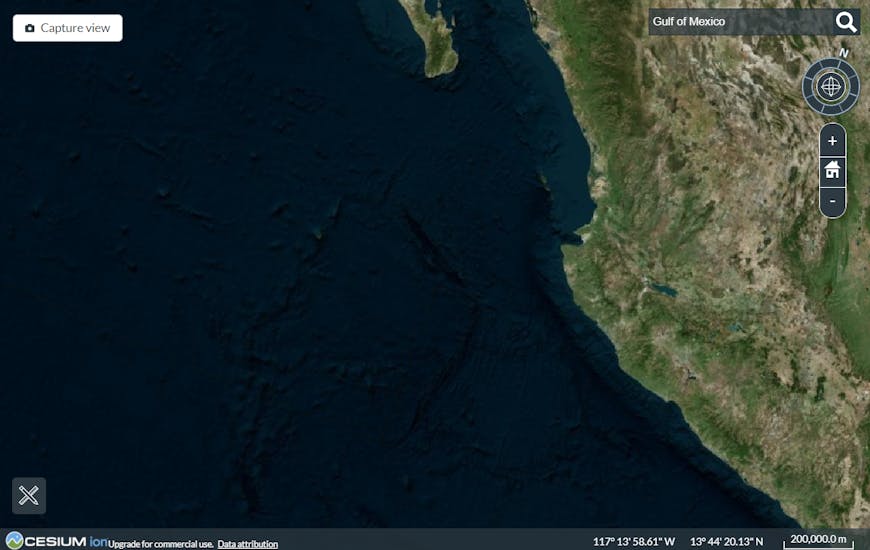
Cesium World Bathymetry of the Pacific Ocean off the coast of California with Bing Aerial imagery
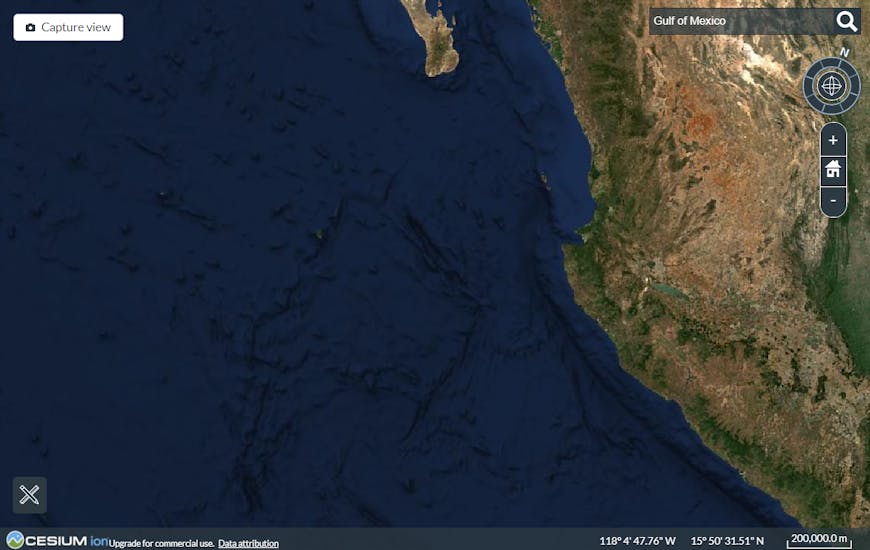
Cesium World Bathymetry of the Pacific Ocean off the coast of California with Sentinel-2 imagery
Visualizations are not limited to satellite imagery. Simplified or stylized imagery, such as Stadia Alidade, provide additional contrast when used in combination with bathymetric terrain and lighting.
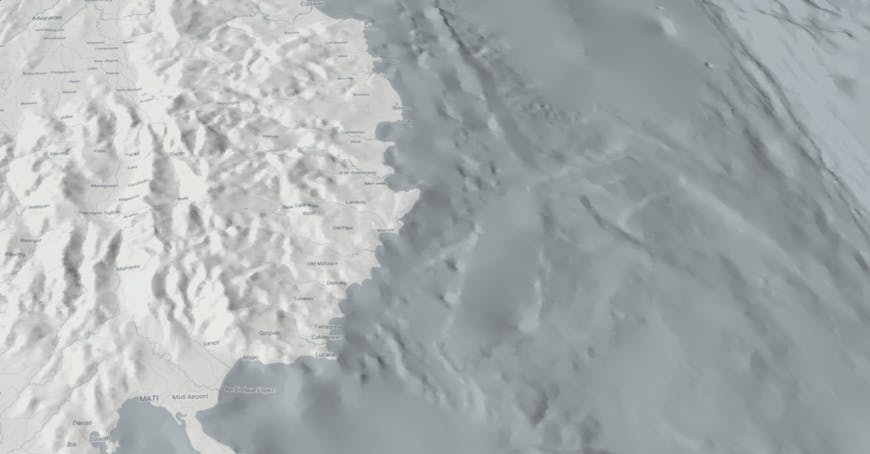
Cesium World Bathymetry with Stadia Alidade imagery off the coast of the Philippines.
Exaggerating the bathymetry elevation magnifies height differences, and can make it much easier to understand subtle elevation changes in the terrain surface.
Cesium World Bathymetry of the Black Sea without exaggeration
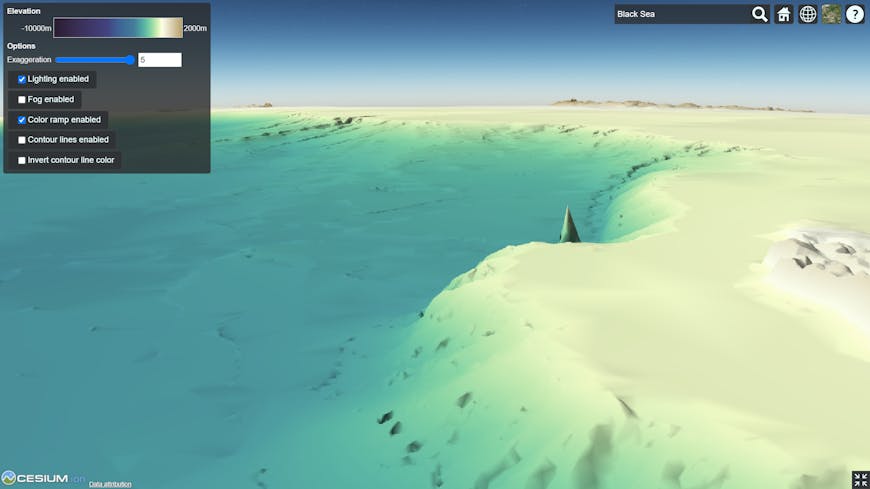
Cesium World Bathymetry of the Black Sea with exaggeration
This sample code will exaggerate terrain by a factor of 5:
viewer.scene.verticalExaggeration = 5.0;
Consider adding a slider to your application allowing users to adjust the exaggeration value.
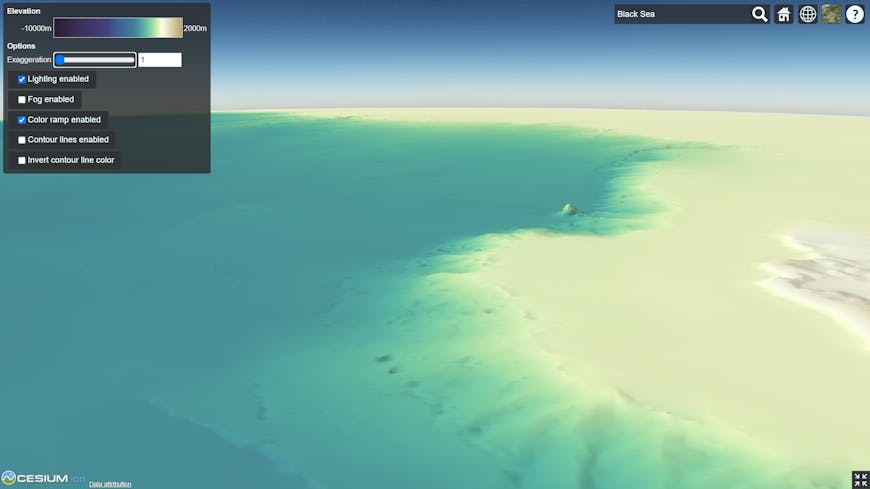
In addition to lighting and exaggeration, procedural shading, such as a color ramp that indicates elevation and elevation contour lines, can add additional visual insights. The sample code below includes one oceanographic color ramp, and allows the users to invert the color of contour lines to make them easier to see against varying background colors. Consider the color ramp values and contour line settings that best fit your use case. Lastly, make sure to include a key or legend to help users understand your visualization.
The following code creates an elevation color ramp, material for color shading, contour lines that increase in density as you get closer. It also updates the material as the user changes values with the controls, and applies the materials.
// Globe material constants
const minHeight = -10000.0;
const approximateSeaLevel = 0.0;
const maxHeight = 2000.0;
const countourLineSpacing = 500.0;

const range = maxHeight - minHeight;
const d = (height) => (height - minHeight) / range;

// Create a color ramp based on https://matplotlib.org/cmocean/#deep
function getColorRamp() {
  const ramp = document.createElement("canvas");
  ramp.width = 100;
  ramp.height = 15;
  const ctx = ramp.getContext("2d");
  const grd = ctx.createLinearGradient(0, 0, 100, 0);

  grd.addColorStop(d(maxHeight), "#B79E6C");
  grd.addColorStop(d(100.0), "#FBFFEE");
  grd.addColorStop(d(0.0), "#F9FCCA");
  grd.addColorStop(d(-500.0), "#BDE7AD");
  grd.addColorStop(d(-1000.0), "#81D2A3");
  grd.addColorStop(d(-1500.0), "#5AB7A4");
  grd.addColorStop(d(-2000.0), "#4C9AA0");
  grd.addColorStop(d(-2500.0), "#437D9A");
  grd.addColorStop(d(-4000.0), "#3E6194");
  grd.addColorStop(d(-5000.0), "#424380");
  grd.addColorStop(d(-8000.0), "#392D52");
  grd.addColorStop(d(minHeight), "#291C2F");

  ctx.fillStyle = grd;
  ctx.fillRect(0, 0, ramp.width, ramp.height);

  return ramp;
}

// Creates a composite material with both elevation shading and contour lines
function getElevationContourMaterial() {
  return new Cesium.Material({
    fabric: {
      type: "ElevationColorContour",
      materials: {
        contourMaterial: {
          type: "ElevationContour",
        },
        elevationRampMaterial: {
          type: "ElevationRamp",
        },
      },
      components: {
        diffuse:
          "(1.0 - contourMaterial.alpha) * elevationRampMaterial.diffuse + contourMaterial.alpha * contourMaterial.diffuse",
        alpha:
          "max(contourMaterial.alpha, elevationRampMaterial.alpha)",
      },
    },
    translucent: false,
  });
}

// Apply the material to the globe
function updateGlobeMaterial() {
    const material = getElevationContourMaterial();
    let shadingUniforms =
      material.materials.elevationRampMaterial.uniforms;
    shadingUniforms.image = getColorRamp();
    shadingUniforms.minimumHeight =
      minHeight * viewer.scene.verticalExaggeration;
    shadingUniforms.maximumHeight =
      maxHeight * viewer.scene.verticalExaggeration;
    shadingUniforms = material.materials.contourMaterial.uniforms;
    shadingUniforms.width = 1.0;
    shadingUniforms.spacing =
      countourLineSpacing * viewer.scene.verticalExaggeration;
    shadingUniforms.color = Cesium.Color.BLACK.withAlpha(0.5);
    viewer.scene.globe.material = material;
}

updateGlobeMaterial();
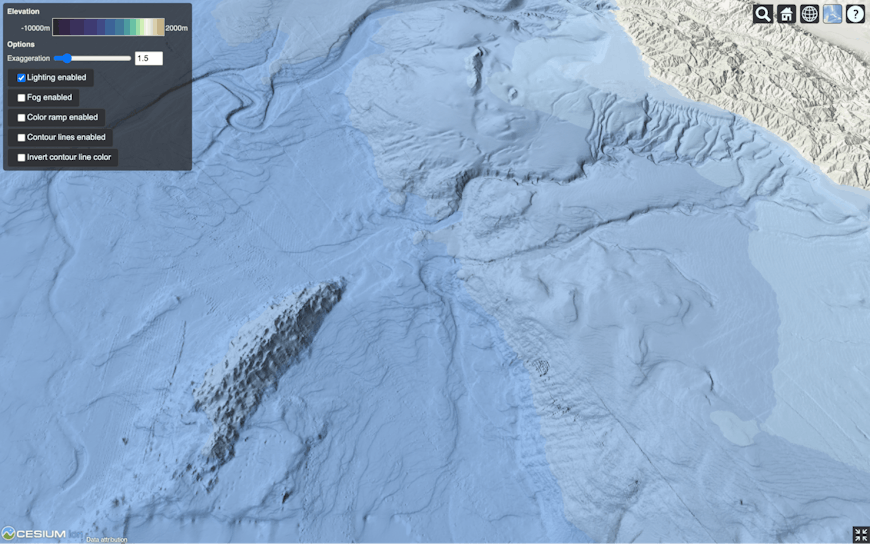
Cesium World Bathymetry off the coast of southern California, USA with Esri World Ocean Imagery
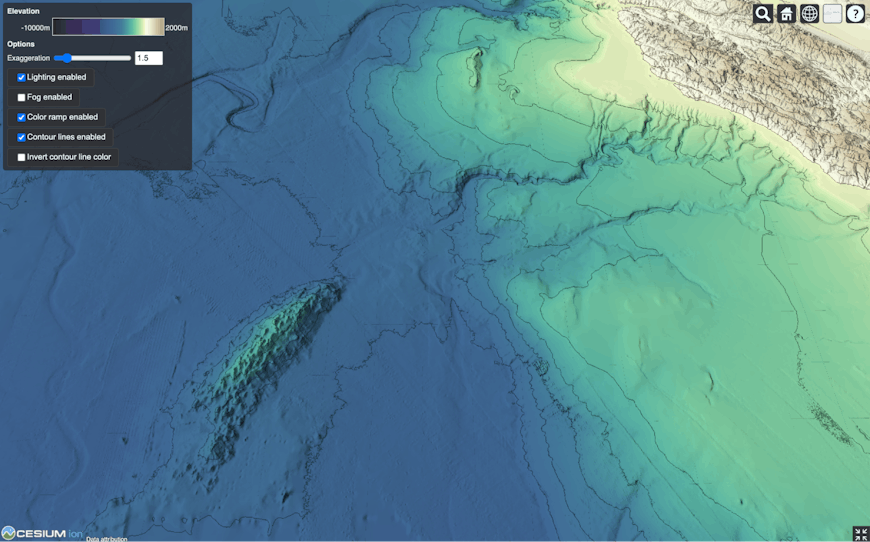
Cesium World Bathymetry off the coast of southern California, USA with an elevation color ramp and contour lines.
Share your thoughts and projects using Cesium World Bathymetry with us on the Cesium Community Forum. We can’t wait to see what you create!