Visualizing Airspace and More with 3D Tiles at OneSky
This is a guest post by Nate McBee of OneSky, which fuses web-based visualization with back-end API analytics to bring enhanced flight-planning and safety analytics to the commercial drone industry. - Sarah
OneSky is leveraging Cesium’s visualization platform in several ways. One of the most notable is within our Unmanned Traffic Management (UTM) framework product. Traditionally, the drone flight community has used 2D maps for mission planning and flight tools. We recognized early on in the development phase that we wanted to instead represent airspace in 3D to provide better situational awareness for pilots and users of the framework. We selected Cesium to represent airspace in 3D.
The challenge arose when we attempted to bring in common geospatial representations in formats such as GeoJSON, which proved to be bulky and introduced performance costs. The breakthrough came when the data was processed and served back to the client in the 3D Tiles format. The performance increases were amazing and opened the door for even larger datasets to be considered and brought into the platform.
Below you can see several examples of controlled airspaces being represented in 3D within the UTM system. This is a really great way to visualize the limitations and boundaries of airspace in all dimensions. These volumes are all being served as 3D Tiles to the client, which not only improves the performance compared to other options, but also provides us options for things like hover and click events to interact with the underlying datasets.
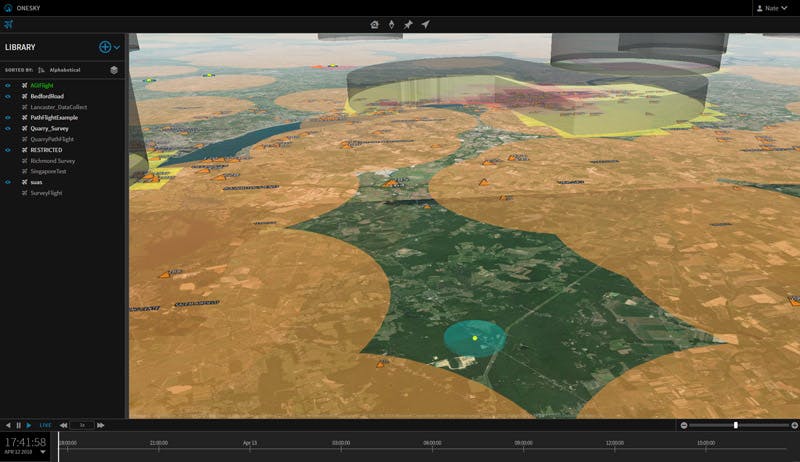
Controlled airspaces represented in 3D within the UTM system.
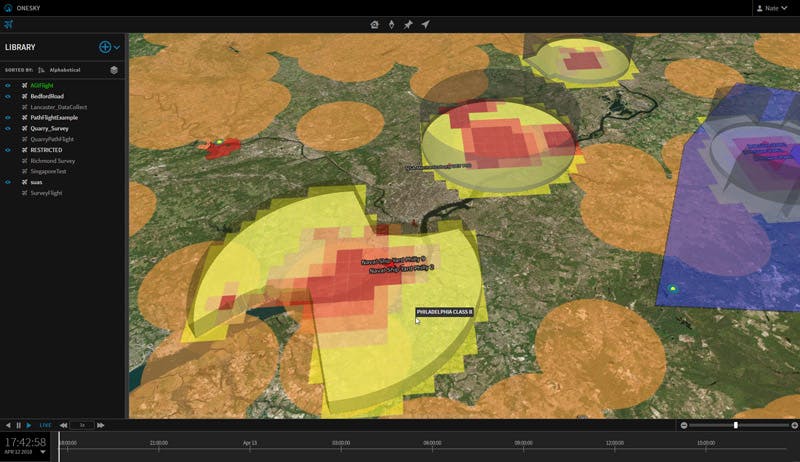
Controlled airspaces represented in 3D within the UTM system.
The UTM Framework isn’t the only OneSky product to take advantage of 3D Tiles. Some of our analytical capabilities are often done with the desktop tool, Systems Tool Kit (STK), where large data sets are used to perform systems-level simulation, such as the regional cellular signals analysis seen below. By exporting these results to the Cesium ion platform, these modeling and simulation efforts can now be shared with anyone. This is possible because of the 3D Tiles formatting, which efficiently streams data, such as 3D buildings, on a large scale. Customers can quickly look at the results and even explore or interact with it right from their browser. Take a look for yourself.
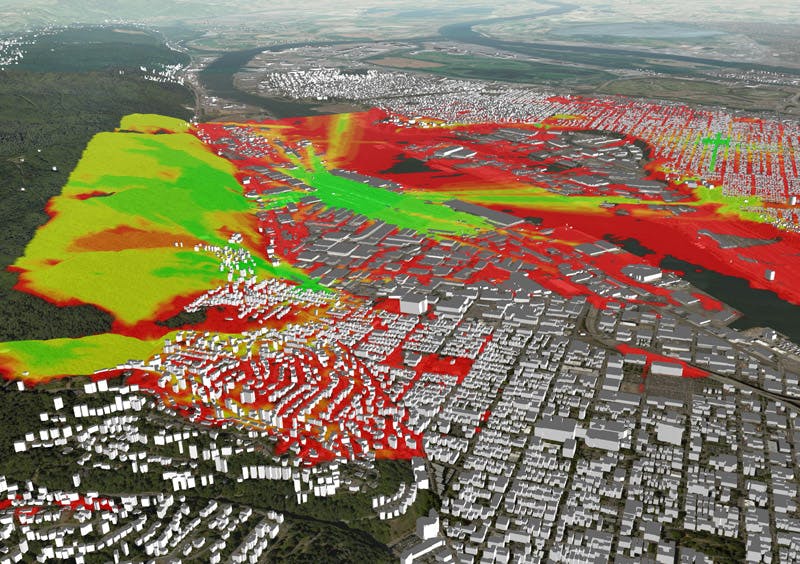
Regional cellular signals analysis.
3D Tiles is helping OneSky provide large and complex datasets to consumers in a very efficient streaming format and provides a rich 3D picture to enhance overall understanding and awareness of the operating environment and situational picture. Without this capability, we would still be relying on 2D map layers or other such methods for distributing these datasets and analytical results.