History of Desalination Plants in the United States
Researchers Jadwiga Ziolkowska and Reuben Reyes of the University of Oklahoma are using Cesium for geospatial and geotemporal visualization of desalination plants in the US. The initial work started using KML and KMZ files in Google Earth and NASA World Wind. Once KML/KMZ support became available in Cesium, a port was completed and put on the web. This made it easy to use and available to anyone with a web browser to view the desalination map of the US. The model/map “History of Desalination Plants in the US” represents US desalination trends in the time span of 63 years (1950 to 2013) with context switching between 4 desalination plant categories. The total number of desalination plants in this visualization is 1,600 entries. The visualization is facilitated by WebGL used in Cesium. The benefit of Cesium is that it allows for smooth and fast viewing, context switching, and interaction with complex data sets.
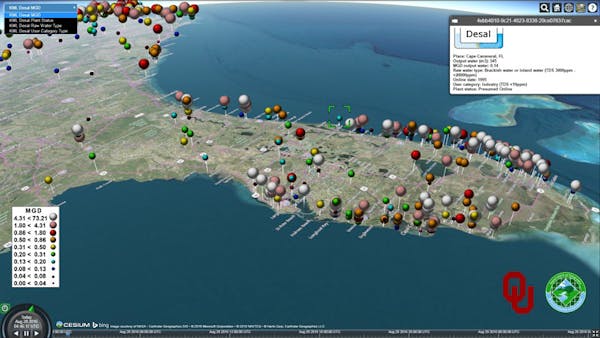
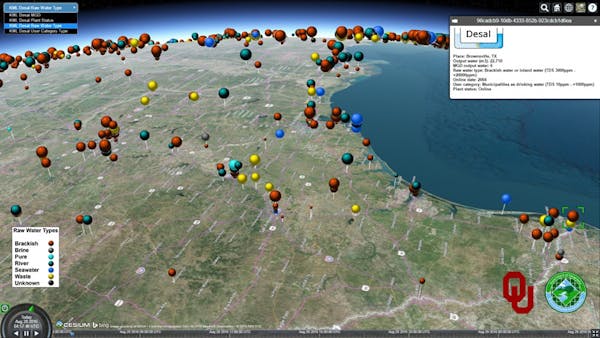
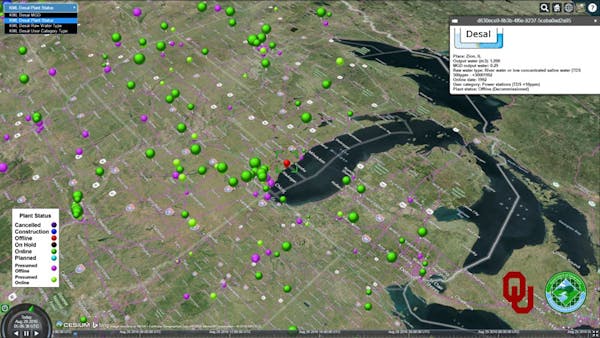
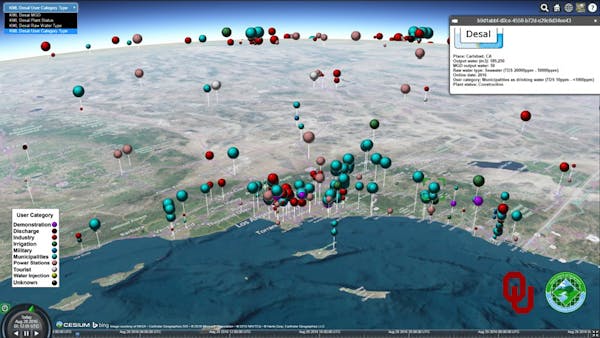
Key parts of this visualization using Cesium was using elevation as a representation of time. Desalination plants closer to the surface are older, and higher plants are newer. In one glance a user can tell if a plant has a history of revisions, is new, or is offline. Cesium also allowed easy switching between plant categories while a user was in any detailed view. This research and visualization resulted in a paper: Ziolkowska, J.R.; Reyes, R. (2016): “Geospatial analysis of desalination in the US: An interactive tool for socio-economic evaluations and decision support,” Applied Geography 71: 115–122.