NASA RapidScat Portal: Near Real-Time Visualization, Exploration, and Analyses of RapidScat Observations
ISS-RapidScat is a NASA Earth-observing mission that measures ocean surface winds from the International Space Station (ISS). Ocean surface vector winds provide critical information about the interaction between the atmosphere and the ocean and help us understand and predict our environment.
The RapidScat instrument was built by NASA’s Jet Propulsion Laboratory as a cost-effective replacement for NASA’s QuikScat Earth satellite. It was launched on September 20, 2014, and has since been providing essential measurements used in El Nino monitoring and weather predictions, including hurricane forecasts.
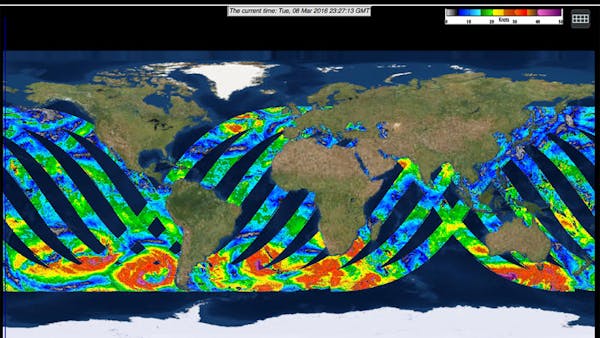
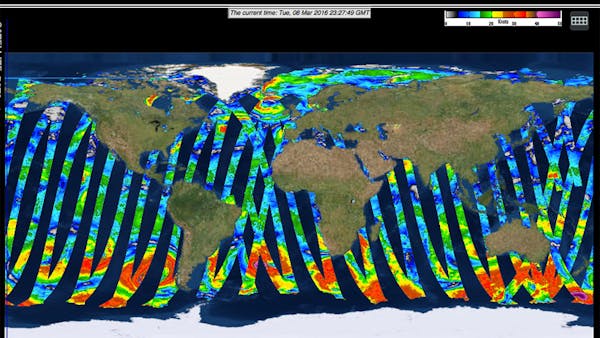
The RapidScat portal is an interactive portal to visualize the ocean wind speed and direction observed by RapidScat. The orbital data arrives with 3-4 hours’ delay and can be viewed as a single orbit or as a composite of 3-hour, 6-hour, 12-hour, or 24-hour.
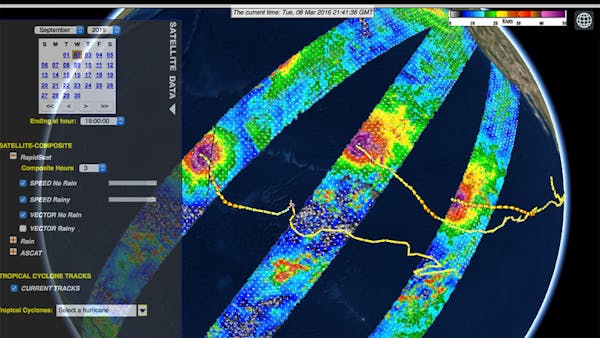
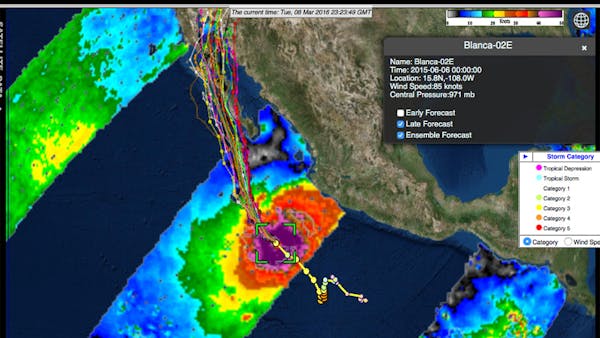
The portal has a special focus on tropical storm monitoring; therefore, it also includes the real-time storm tracks (updated at every 6 hours) and NOAA hurricane forecast tracks from multiple models. To provide a comprehensive depiction of the ocean surface winds, the portal includes near real-time wind measurement from another instrument: the European Advanced Scatterometer (ASCAT). To facilitate the understanding of the relationships between wind and rain, the portal also includes precipitation measurements from two microwave instruments, GMI (the Global Precipitation Microwave Imager) and AMSR2 (Advanced Microwave Scanning Radiometer). All the image data can be overlaid on top of each other with transparency control. The wind vectors and wind speed are separate layers that can be viewed together or separately. We have archived the scatterometer data since November 2014, and the archived data can be viewed via a calendar-controlled menu panel.
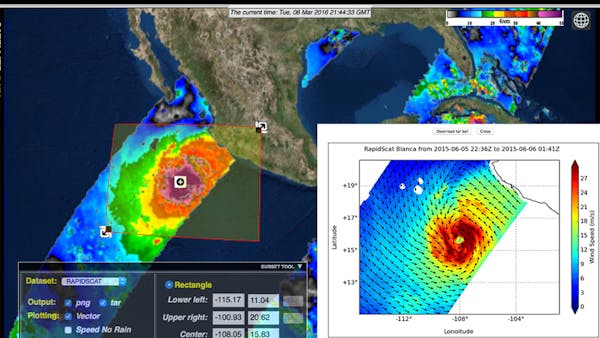
The RapidScat portal allows users to select a subset of data by using a rectangular subsetting tool. The portal will generate a wind map with the data in the selected area and put together a tarball of the original data for users to download. The subsetting tool works with either the RapidScat or the ASCAT wind products.
The RapidScat portal was originally designed using Google Earth. All the image overlays and vector products were represented using KML files. The migration from Google Earth to Cesium was mostly smooth. We were able to preserve nearly all of our KML file formats except for the wind vector products.
For the best performance in Cesium, we implemented wind vectors using Cesium’s PolylineCollection instead of KML, thereby improving rendering speed. We also had to figure out how to display the colormap on Cesium because the screenOverlay tag in KML is not supported by Cesium We used ScreenSpaceEventHandler object to implement the selection tool on the Cesium 3D globe.