Analyze Four-Dimensional Observational Data with GridViz
With GRID VIZ users can analyze four-dimensional observational data from multiple angles. GRID VIZ allows them to easily extract multivariable grid data as they wish, and enables real-time visualization anywhere, anytime. There is only one requirement to use it: a browser that supports WebGL.
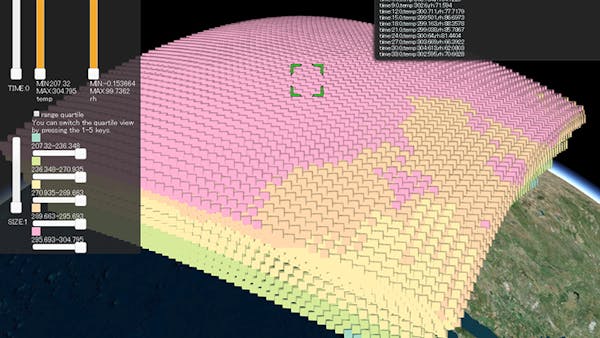
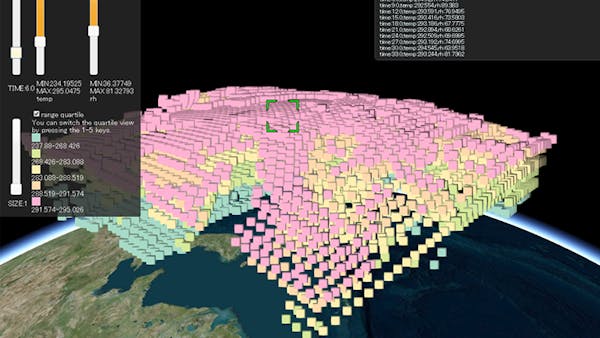
Created by the R & D department at Northern System Service Company, GRID VIZ makes possible easy visualization of grid data with longitude and latitude. GRID VIZ visualizes volume using the billboard feature of Cesium. It’s a rather simple mechanism, but because it allows you to quickly give form to your ideas, it makes Cesium the best tool for data visualization.
This demo uses four-dimensional (time, longitude, latitude, and atmospheric pressure) data from the Japan Meteorological Agency. Users can visualize the variable space they want to observe by filtering each variable and moving the time axis. Also, when filtering with variables, they can view the distribution of data intuitively by dividing the spaces by color into quartiles.
Users filter for the desired data by controlling the slide bar. The TIME slide is fixed, but the other slide bars change according to the varCols of the GET parameter of the URL. The default display is a quartile of the variable farthest to the left, but when users change the range of the variable, it will then display the quartile of the selected variable. gridStep, from the URL parameter, shows the degree of fineness of longitude and latitude. To quickly see the overview, they increase the gridStep of the URL parameter; to view at smaller increments, users decrease the parameter.