ActiveFlight: Multi-Layered Weather and Flight Path Visualization with 3D Tiles
The ActiveFlight application shows current, historical, or simulated flight paths along with present or historical weather. Developed by the William J. Hughes Technical Center at the Federal Aviation Administration, ActiveFlight visualizes weather data alongside historical flight tracks, allowing usrs to analyze potential interactions.
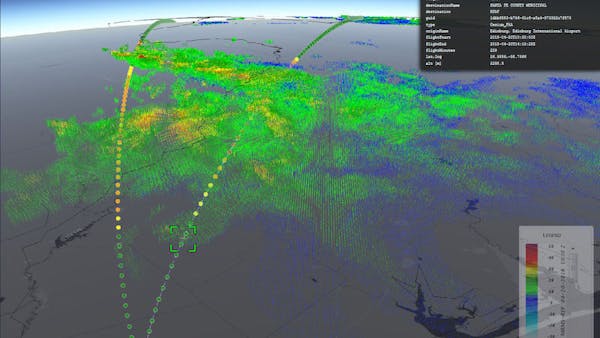
To demonstrate how a flight interacted with the weather it encountered, ActiveFlight accesses a local proximity service that combines the flight position with a value ranging from 0 to 6, which represents its proximity to weather at that time.
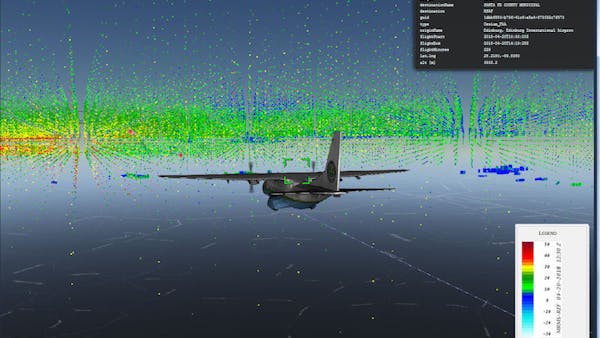
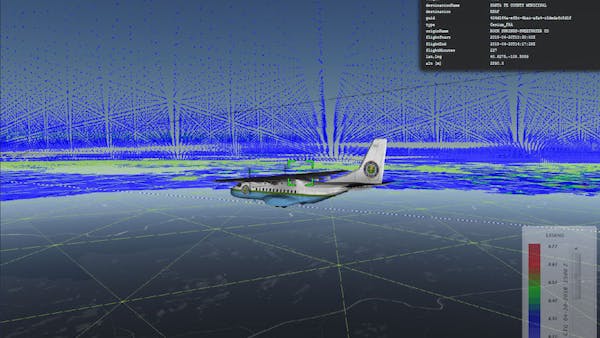
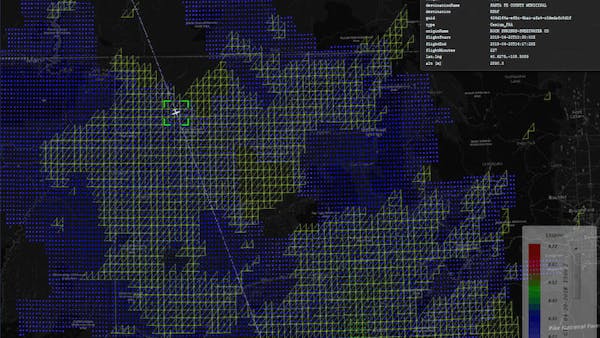
Display of weather on the Cesium globe begins with accessing a service that delivers NetCDF or GRIB data files for various weather types, such as reflectivity, turbulence, or icing. After converting to either point cloud or batched 3D model with embedded glTF v2.0 formatted tiles, the 3D Tile resource is hosted as a local service. On the client side, upon request, the Cesium 3D Tiles API and Cesium3DTileset is used to access the url source of the tileset.json. An altitude property value used for declarative styling is embedded in each returned layer and allows the client to select the visibility of a single altitude layer or all layers at once.
To depict multiple simultaneous flights, the application uses Cesium’s SampledPositonProperty. Points along each flight path are modeled this way, allowing for the Cesium clock to control flight animations. Various weather products may be represented, not as flat images on the earth surface, but as layer data at their actual elevation.
New technologies such as 3D Tiles and the ability to create a 3D point cloud representation of weather data will be useful visualization tools in a variety of areas, including historical flight analysis, accident investigations, safety analysis, and research.