Tiling Vectors (Technology Preview)
Cesium ion allows you to tile massive vector datasets, share them on the web, and combine them with other types of content in the same scene, like 3D terrain and satellite imagery.
This guide explains how.
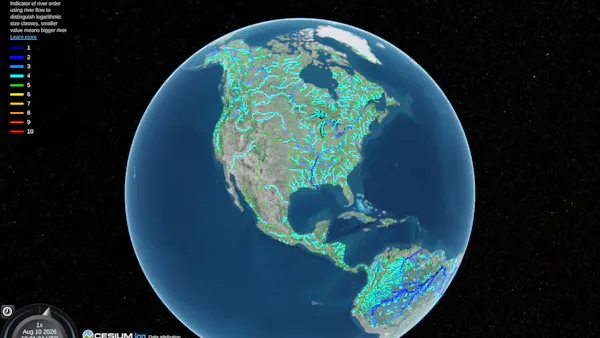
Global river flows dataset from HydroRIVER. North American view.

Global river flows dataset from HydroRIVER. Zoomed in at the Mississippi River.
You need a Cesium ion account to take this tutorial.
Cesium ion is an open platform for tiling and hosting. It will serve your point clouds as 3D Tiles to any compatible client, like CesiumJS.
| Format | File extensions |
|---|---|
| GeoJSON | .geojson .json |
| TopoJSON | .topojson |
| Shapefile | .shp (with .shx, .dbf and optional .prj, .cpg) |
| Geodatabase | .gdb (directory) |
| GeoPackage | .gpkg |
| KML / KMZ | .kml, .kmz |
- Files may be zipped. Shapefiles and Geodatabase files must be in directory and uploaded as a zip.
- Vector data files may contain feature property values.
- The Coordinate Reference System (CRS) is read from the source when available. If no CRS is present, EPSG:4326 (WGS84 lon/lat) is assumed.
- Elevation units are assumed to be in meters.
- 3D geometries and their multi-part variants are supported; M (measure) values are ignored.
- [GeoPackage] Curved geometries are automatically linearized to straight-line approximations.
- [KML / KMZ] Non-vector content (Overlays and Models) and styling (Styles, icons, colors) are ignored.
Cesium ion tiles your points, lines, and polygons into 3D Tiles when you upload it.
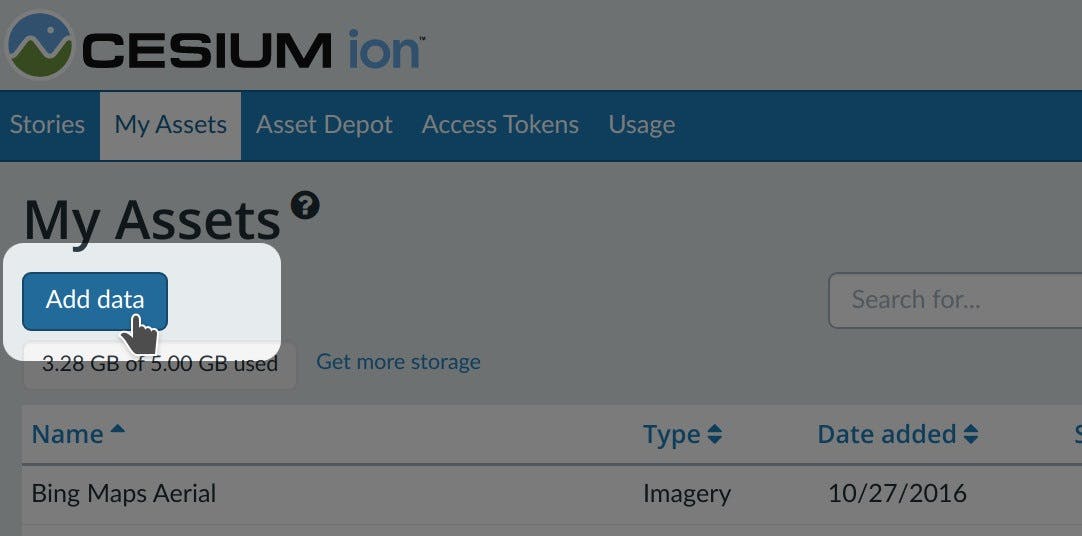
- On the My Assets tab of Cesium ion, press Add Data.
- Select Add Files and upload a source vector file.
- Select “tile as 3D Tiles” for the data kind to enable tiling.
Add multiple files at the same time to merge them into a single 3D Tileset.
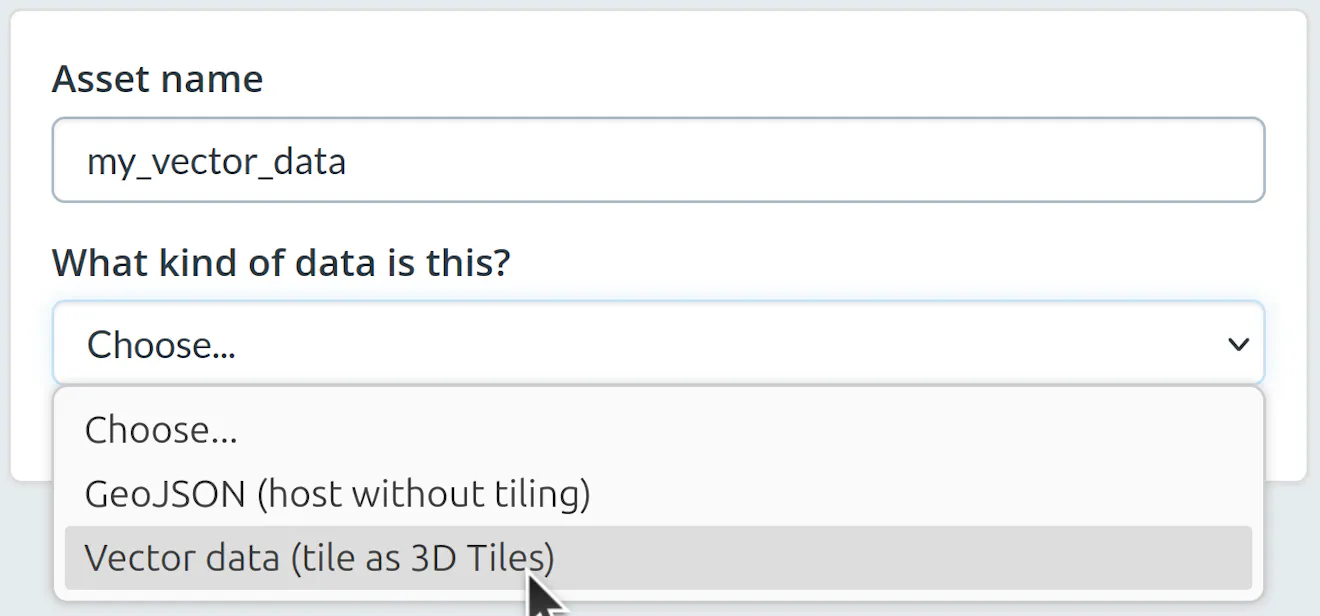
If choosing to tile, you will see a new section with optional fields:
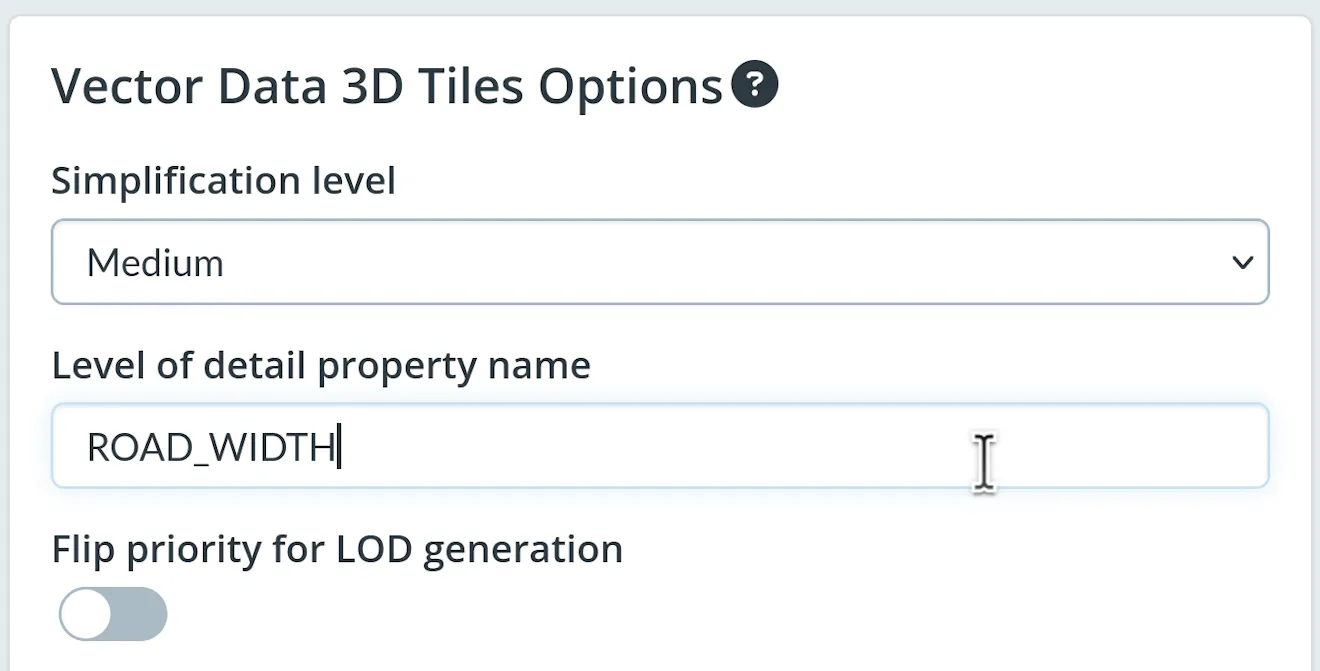
Simplification level can be set to Low, Medium, or High. Higher levels produce sparser visualizations at distant camera views. Defaults to Medium.
Level of detail property name specifies the feature property used for LOD generation. Features with higher property values are more likely to appear at distant camera views. Defaults to empty, in which case LOD is generated from feature geometry size.
Flip priority for LOD generation will use a flipped value given the input in Level of detail property name. Default to not enabled, which prioritizes geometries with larger property values for visualization at further camera distances; enabling the option will produce geometries with smaller property values to be prioritized instead.
The easiest way to visualize and share your asset is using Cesium Stories.
- In the Stories tab, click New Story.
- Under Assets, click the Add asset button and choose your asset.
- Click on the zoom button (magnifying glass) to go to your asset in the scene. Adjust the view to your liking.
- Click on Capture view to save the view.
- Click Share and give your story a name.
You can now share your data in an interactive scene! Learn more about Stories with this tutorial.
Use your asset in a custom app
When you click on an asset in My Assets, you’ll see a preview panel on the right side of the screen.
- The preview panel displays the asset ID, which you’ll need for loading this asset in CesiumJS or other engines.
- You’ll find a code snippet for loading this asset in CesiumJS at the bottom of this panel.
- Click Open complete code example to see your asset in Sandcastle.
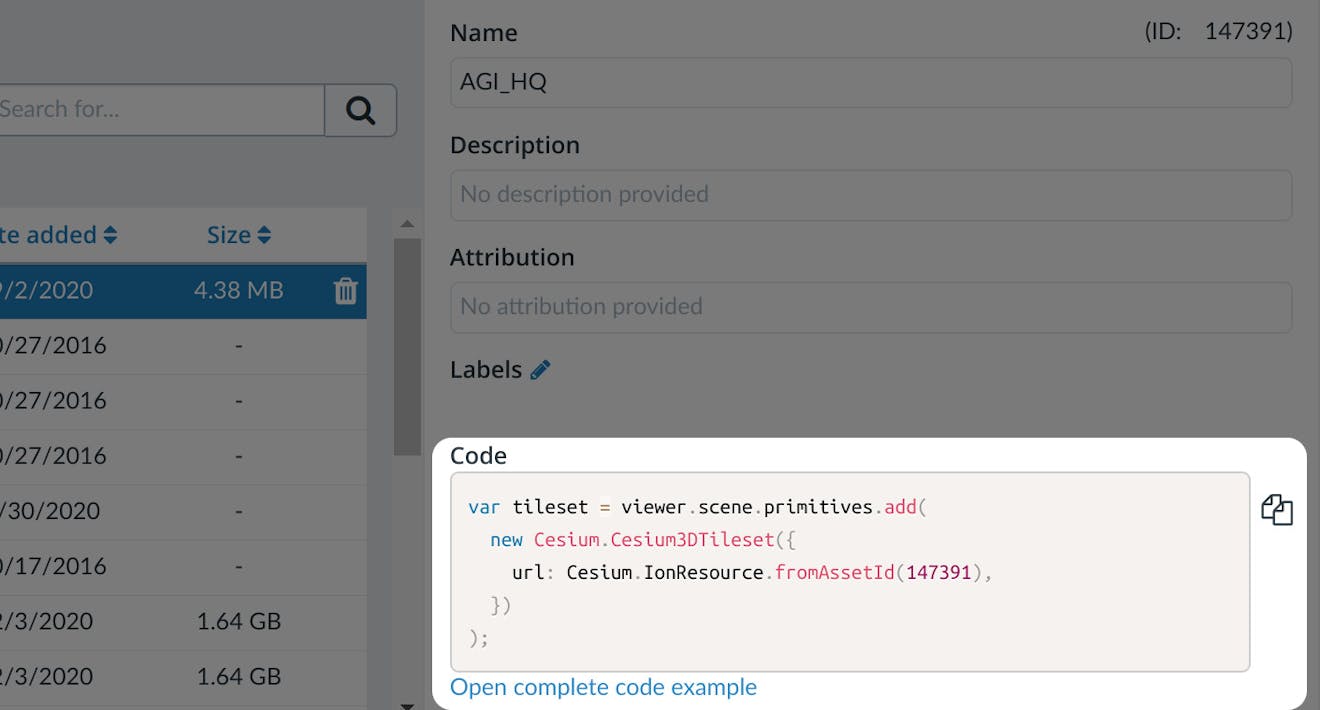
You’ll find a code example for adding this asset to your CesiumJS app at the bottom of the asset preview window.
Learn how to set up a CesiumJS app with the quickstart guide.
Styling
Vector data in 3D Tiles are styled using the 3D Tiles Styling Language. Visual options (color, opacity, point size...) can be assigned explicit values affecting the entire tileset globally, or may be assigned conditions by which to evaluate styles for each feature individually, based on properties associated with each feature:
    show: true,

    color: {

        conditions: [

            ["${construction_year} < 1900", "color('#4b0082', 0.8)"],

            ["${construction_year} < 1940", "color('#0000cd', 0.8)"],

            ["${construction_year} < 1970", "color('#008080', 0.8)"],

            ["${construction_year} < 1990", "color('#228b22', 0.8)"],

            ["${construction_year} < 2000", "color('#ffd700', 0.8)"],

            ["${construction_year} < 2010", "color('#ff8c00', 0.8)"],

            ["true", "color('#ff3300', 0.8)"],

        ],

    },

});