Create an Interactive 3D Presentation with Cesium Stories
This tutorial will walk you through how to use Cesium Stories to create an interactive 3D presentation showing how Melbourne tracks pedestrian activity.
You’ll learn how to:
- Create a story with multiple scenes
- Include Google Photorealistic 3D Tiles or additional 3D data in your story
- Upload your own 2D data and add it to a scene
- Share an annotated story on the web
See the final story we’re creating in this tutorial.
Create a Cesium ion account if you don’t already have one.
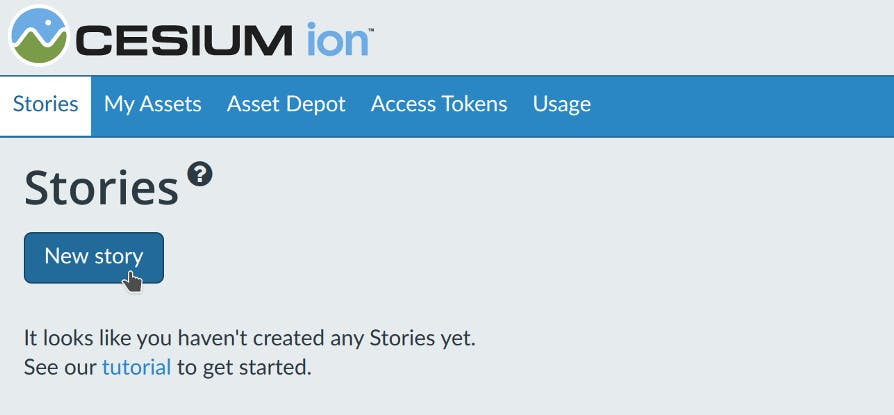
Navigate to the Stories tab and then click the New Story button:
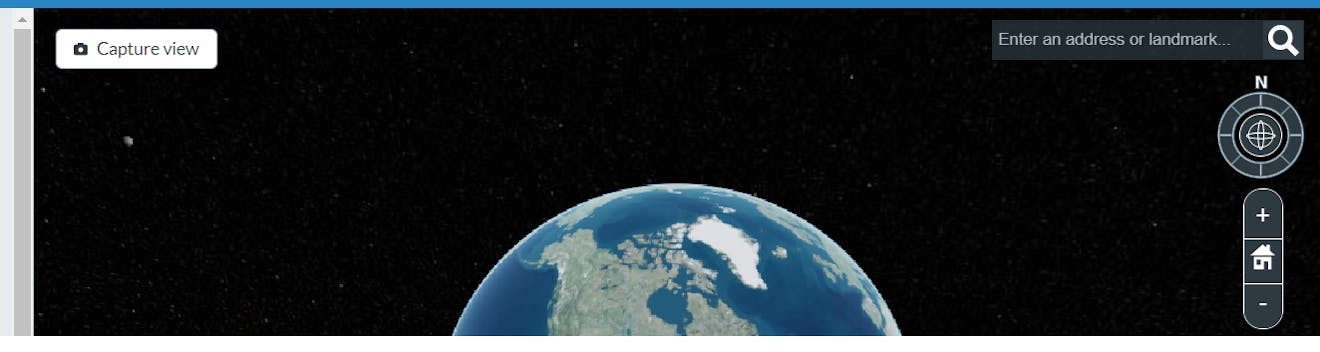
This will open up the Stories editor:
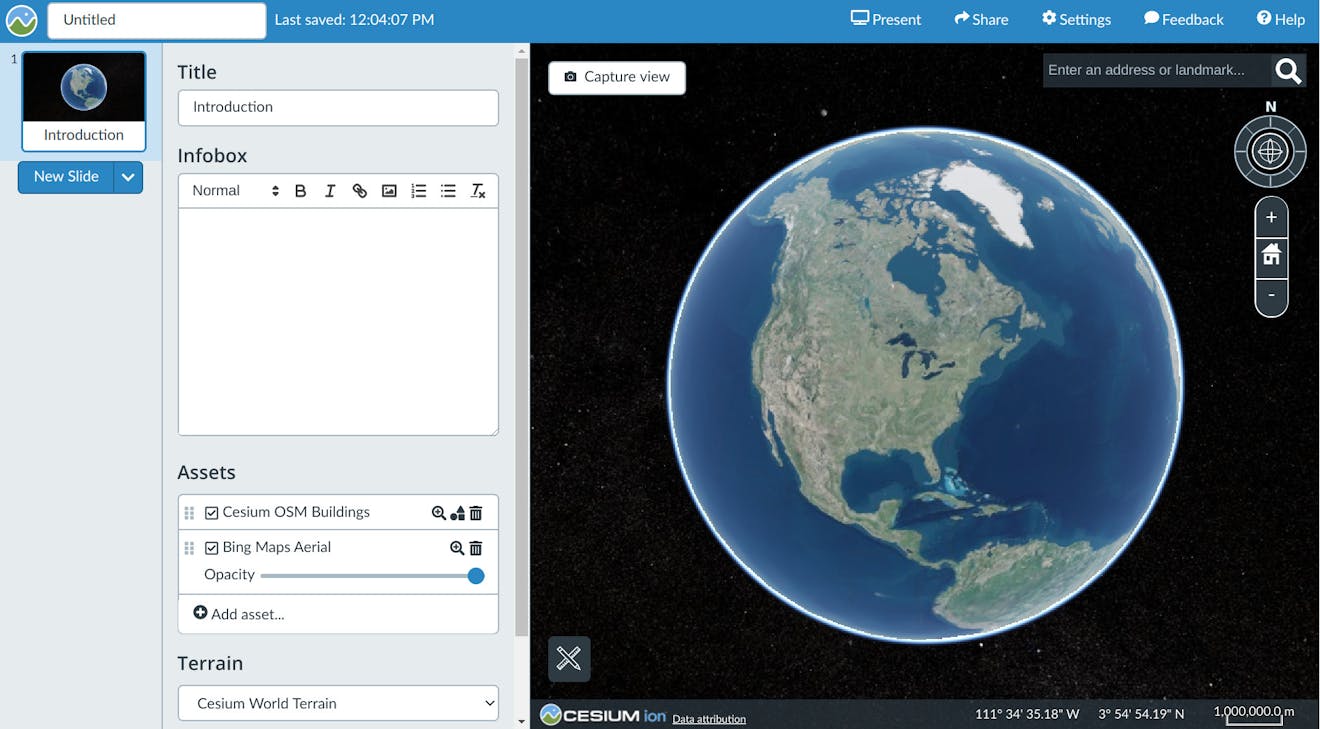
Cesium Stories includes Cesium World Terrain, Cesium OSM Buildings, and Bing Imagery by default. You can also access Photorealistic 3D Tiles from Google Maps Platform. These global layers provide real-world context to your story and act as a base on which to layer your own data. In this tutorial we’ll be interacting with 3D data for the city of Melbourne, Australia.
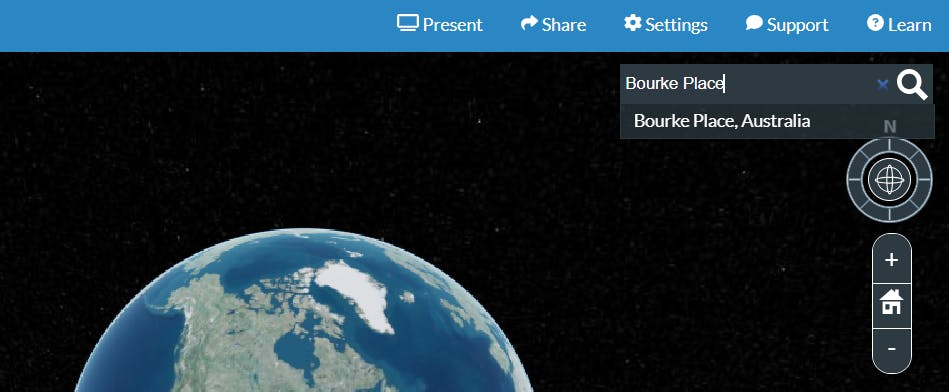
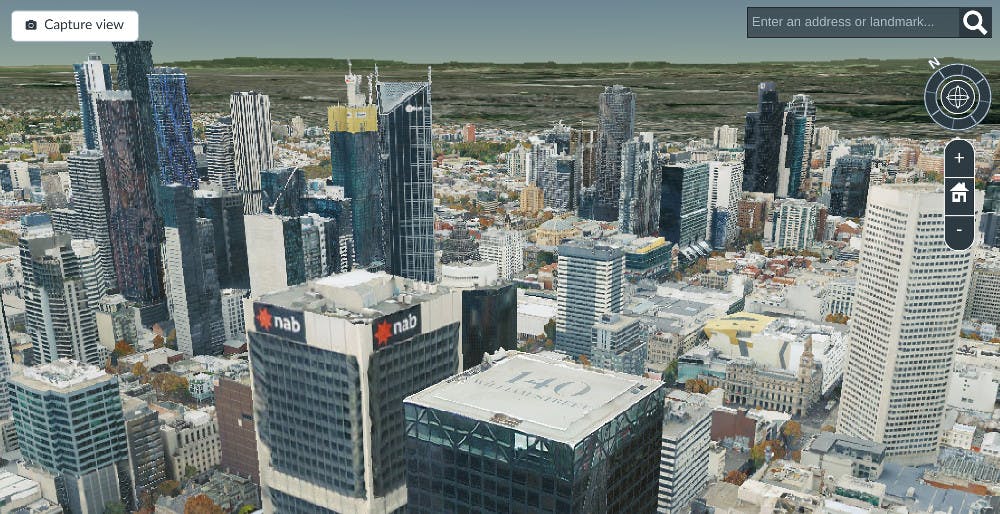
Let’s first take a look at the area where our story will take place. Type “Bourke Place, Australia” in the search bar in the top right and select the first result:
You’ll see all the buildings in Melbourne from the Cesium OSM Buildings layer. Here you can click any building to view its feature data, like name, height, or address if it contains that information.
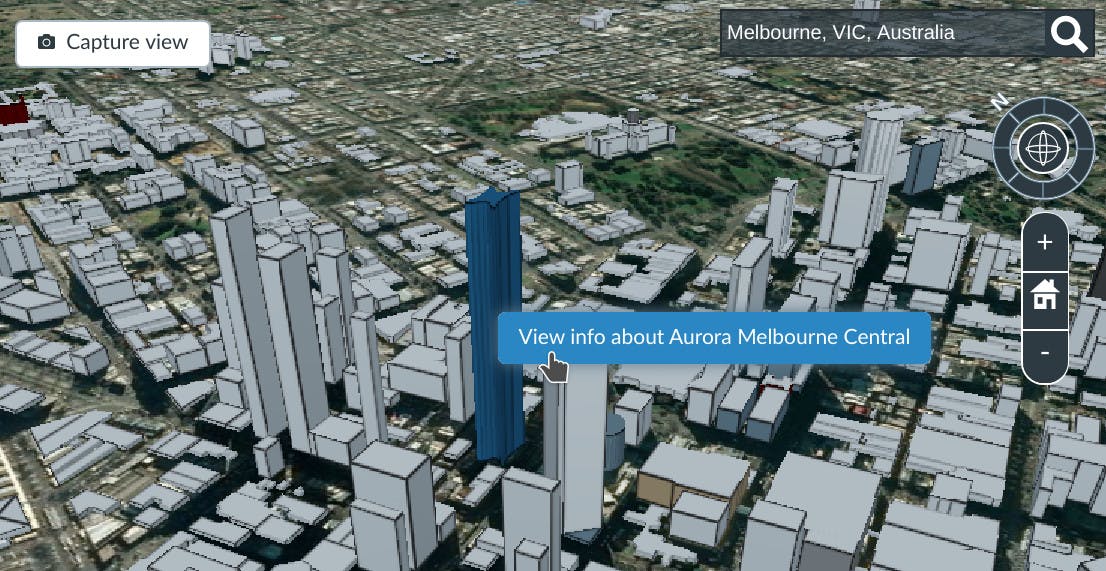
Click the Capture View button at the top. This will save your location in case you close your story while you're working.
At any time you can press the home icon in the top right camera controls to reset the camera back to the saved view for the current slide.
Cesium Stories auto-saves by default, so you won’t lose any written content or data you’ve added.
Camera views save only when you click Capture view, and not automatically like everything else, to allow you to move the camera and explore the scene without accidentally overwriting the views you’ve choreographed for your audience.
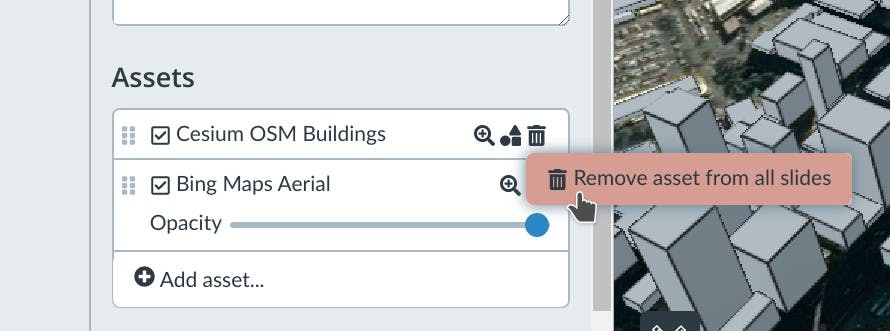
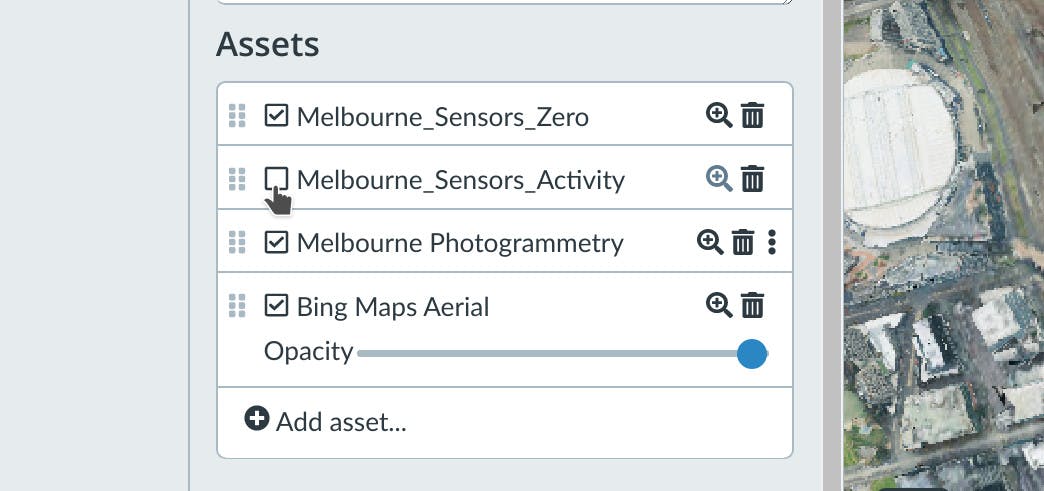
We’re going to replace this buildings layer, so go ahead and delete Cesium OSM Buildings from your story using the assets panel on the left:
Next, you'll add new 3D data for the city of Melbourne. You can choose to include Photorealistic 3D Tiles from Google Maps Platform or a high resolution drone capture of the city of Melbourne.
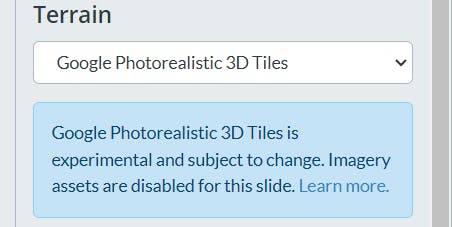
When you make this selection, other imagery layers that were previously included in Assets are automatically deselected and removed from the view because they would be redundant to Photorealistic 3D Tiles.
The first step is to add a 3D Melbourne tileset to your Cesium ion account. This model is already available on the Cesium ion Asset Depot, where we curate data that you can use in your stories.
Click on the Cesium ion icon in the upper left of the screen to exit Cesium Stories.
Navigate to the Asset Depot.
Search for Melbourne Photogrammetry and click Add to my assets:
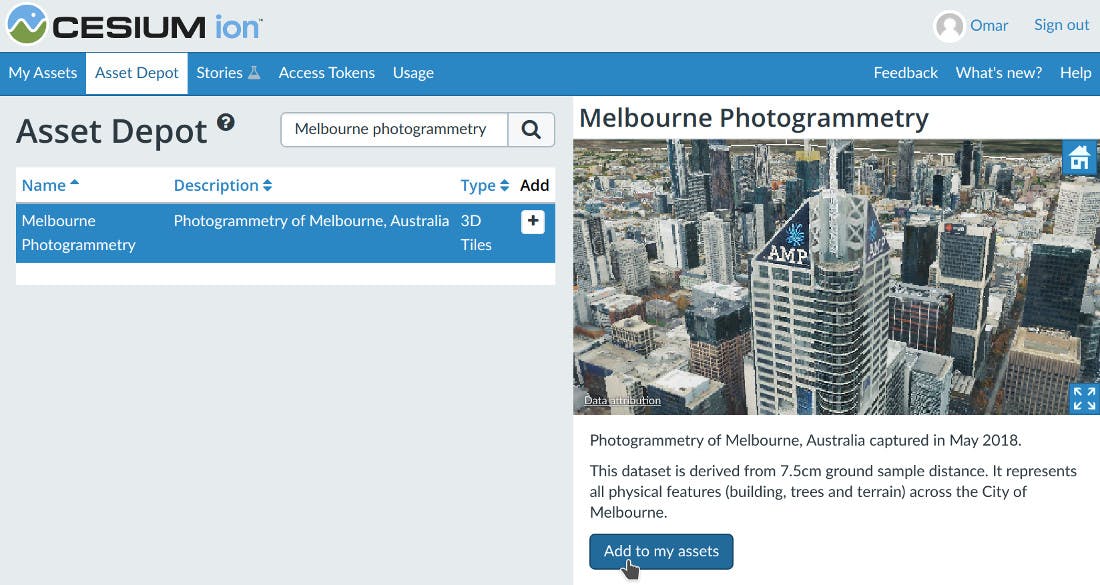
This asset is now ready to use in your story.
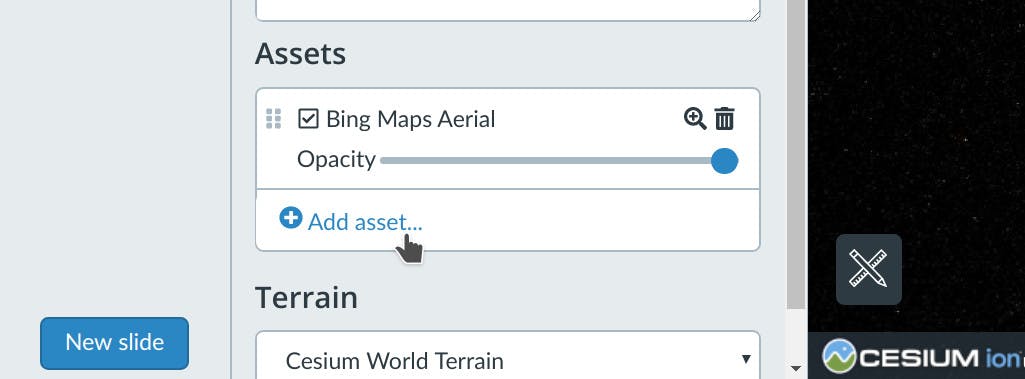
Reopen your story in the story editor, and click Add asset:
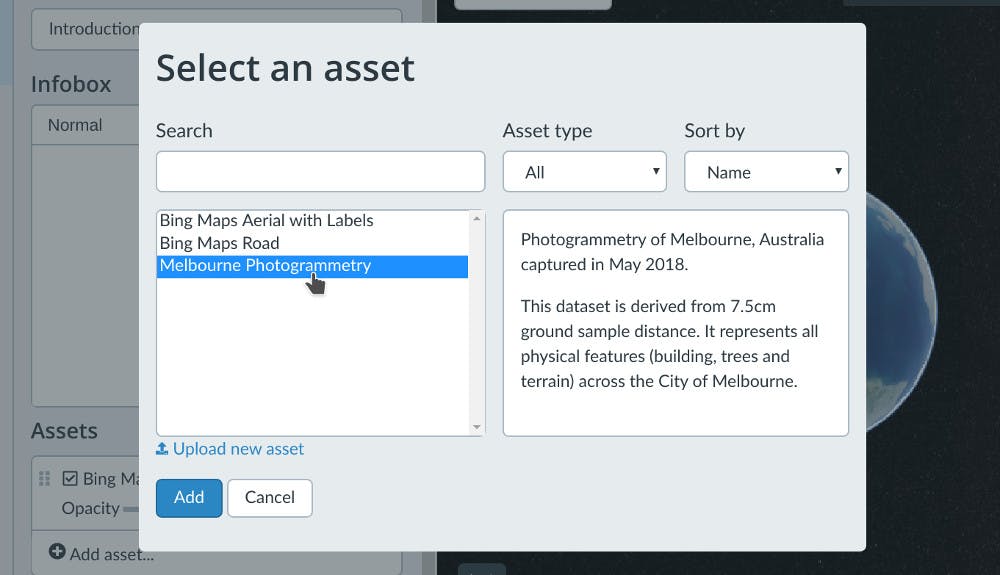
Double-click the Melbourne photogrammetry model to add it to your story:
You now have the Melbourne photogrammetry model in your story.
This model is over 10 GB in size, but we can efficiently load it over the web because Cesium ion tiles 3D data into 3D Tiles.
This makes it possible to create scenes with massive 3D content without losing detail.
To set the scene for our story, we’d like this first slide to start with a nice view of the city. Go ahead and explore the photogrammetry model in the 3D view using your mouse or touch screen. The camera controls in the top right corner allow you to rotate and tilt the camera, as well as zoom in and out.
Here’s the view we ended up with for our story:
Once you’re happy with your view, click the Capture View button at the top.
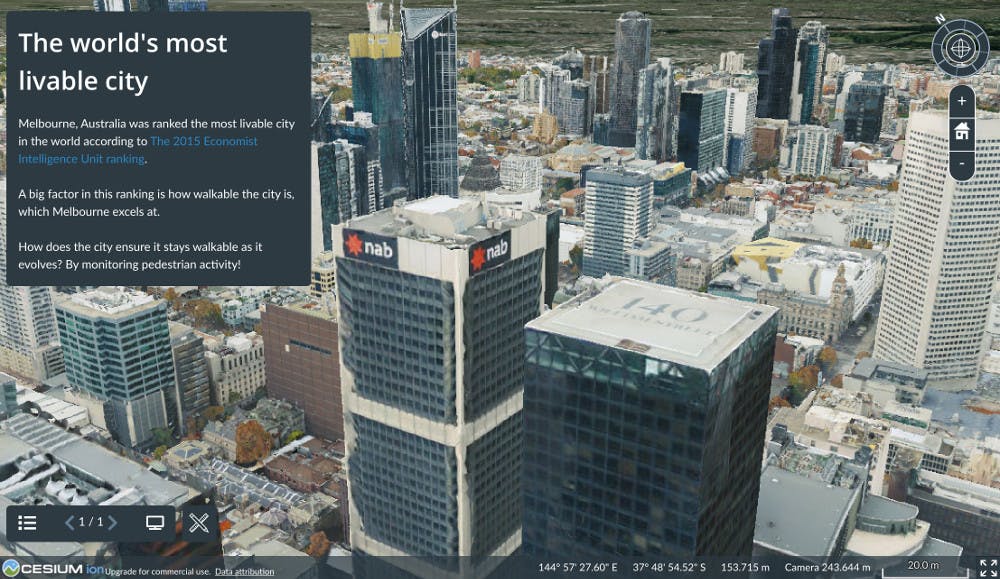
Let’s add some content to introduce the reader to our story. Give your slide a title like:
The world’s most livable city
And then copy the following text and paste it into the infobox input:
Melbourne, Australia was ranked the most livable city in the world according to The 2015 Economist Intelligence Unit ranking.
A big factor in this ranking is how walkable the city is, which Melbourne excels at.
How does the city ensure it stays walkable as it evolves? By monitoring pedestrian activity!
This content shows up in your slide when you present your story, this is a good time to see how things look so far.
Click Present in the top right. This will launch the Stories viewer in another window. You should see your infobox content appear in the slide:
We haven’t shared the presentation yet, so this link is just for you. Close this window and go back to the editor.
For the second slide, we want to overlay the locations of all the pedestrian sensors that the city of Melbourne has on top of this 3D map. You can do this by uploading a KML, GeoJSON, or CZML dataset that marks these locations.
Uploading data to your story
At any time in the Stories editor you can drag and drop a dataset to add it to your Cesium ion account. Any data you upload gets stored in your Cesium ion account, where you can re-use it across slides or different stories.
First, click New Slide and create a new Map slide:

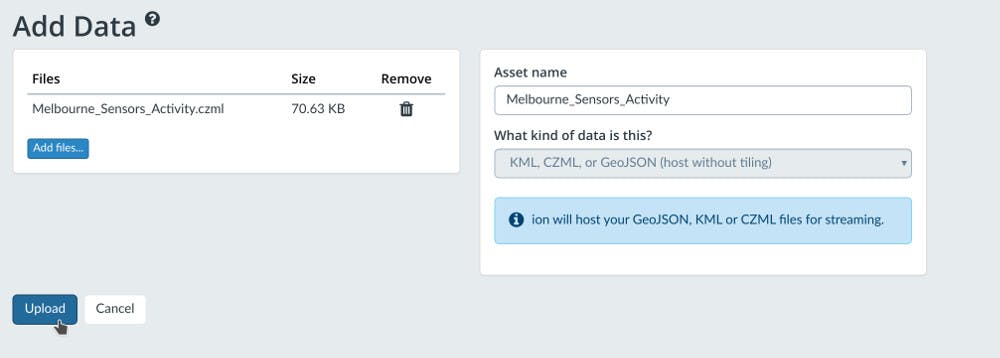
Then download this CZML file that contains the locations and metadata for the sensors. Drag and drop it anywhere in the editor.
Finally press Upload as shown below:
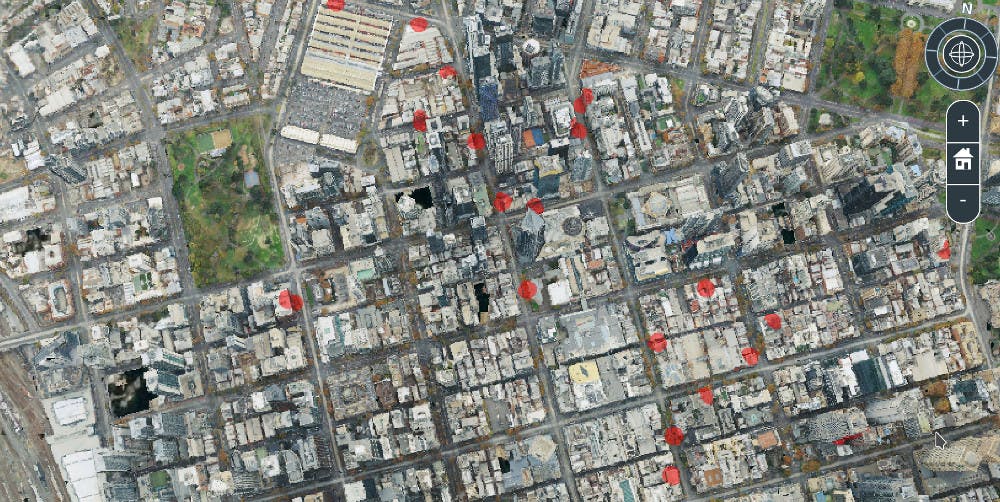
Once the file finishes uploading, click the magnifying glass icon next to its name in the assets list to fly the camera to it. You should now see an overview of all 50 locations of the sensors across the city:
Click Capture View. You can now fill out the title and infobox on this slide with some information about these sensors.
Here’s what we had in our slide:
Title: The pedestrian counting system
Infobox: The city has around 50 of these “pedestrian sensors” strategically placed around the city, marked here in red.
These are just simple infrared beam sensors, not cameras. They’re placed on street lamps or under awnings to keep count of how many people pass underneath.
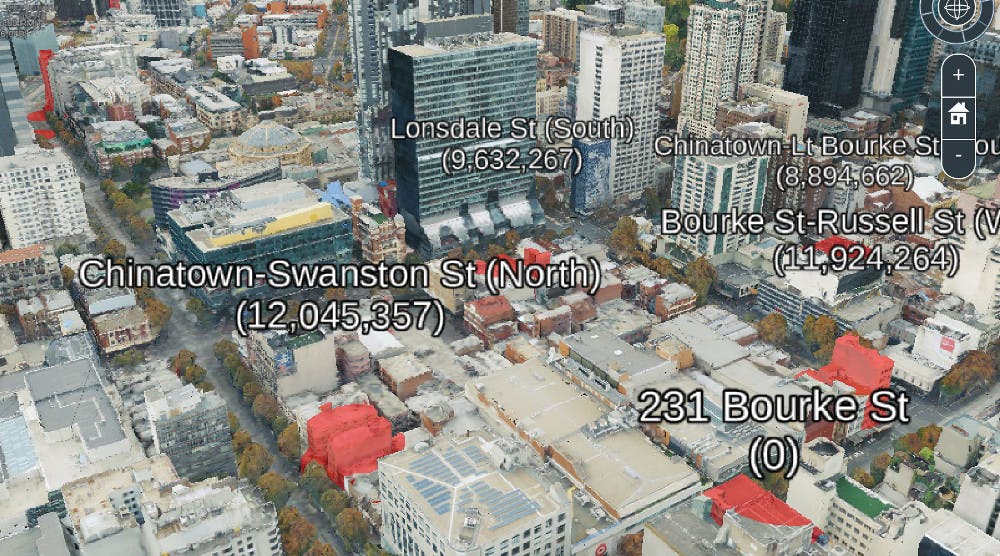
The CZML file we added doesn’t just mark the locations of the sensors. It also has labels for the name of each sensor, and how many pedestrians it has counted since 2009. We’ve set up these labels to appear when the camera approaches them.
Try zooming in to any of the red spots in the city to see this metadata:
Once you find an interesting view you’d like to save, you can create a new map slide. This will save the current view into the newly created slide.
Click to inspect feature data
Here is where we noticed something odd - that 231 Bourke St sensor is showing 0 pedestrian counts. This seems very strange given that this is the business district of Melbourne, and all the sensors around it are counting millions of people.
To figure out what’s unique about this sensor, try clicking on it then click the View info button to see all its data.
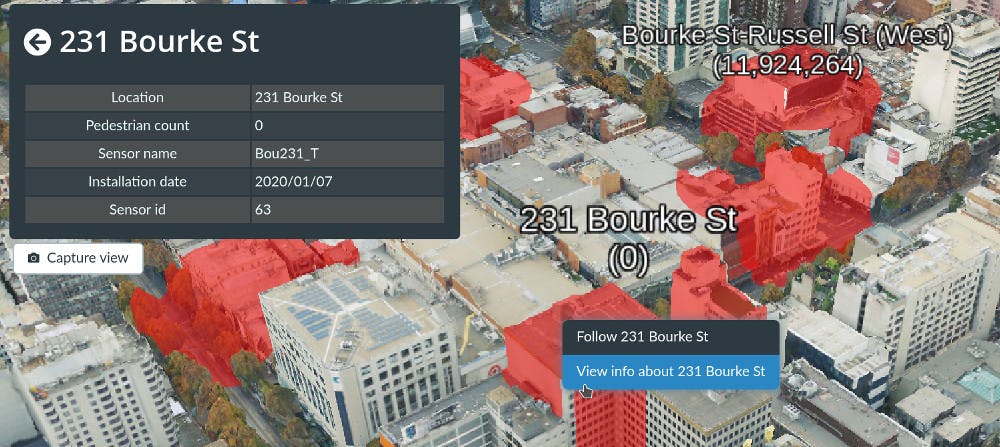
We can see from the installation date that this is one of the newest sensors. It was installed in the same week we originally pulled this dataset! So it must not have had a chance to have its reading uploaded.
There is only one other sensor that has a zero count. Can you find it and create a new slide for it?
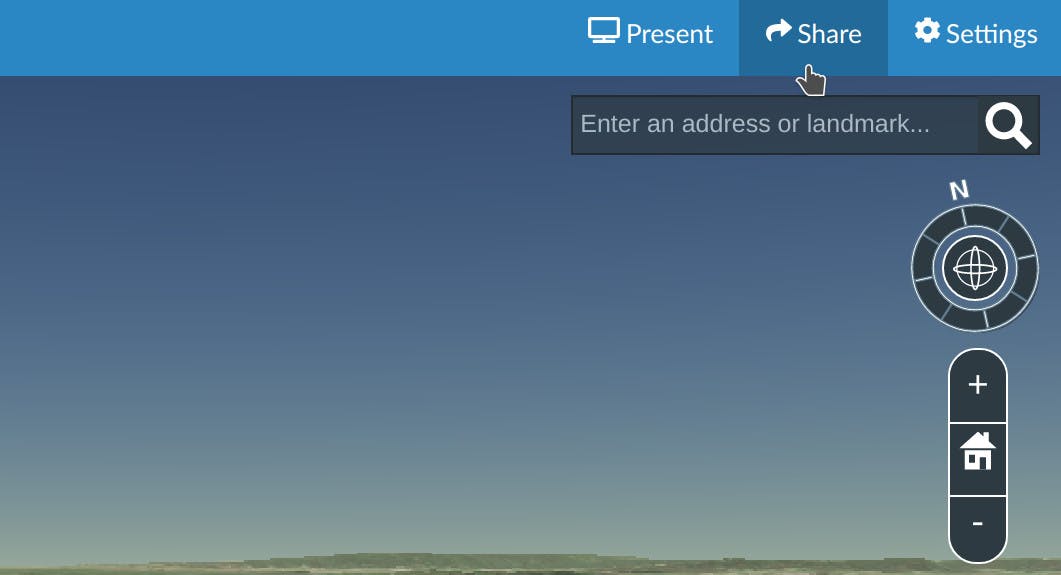
Once you’re ready to share your presentation, click the Share button in the top right:
Give your story a title like Melbourne’s Pedestrian Sensors.
Then toggle the Enable Sharing button:
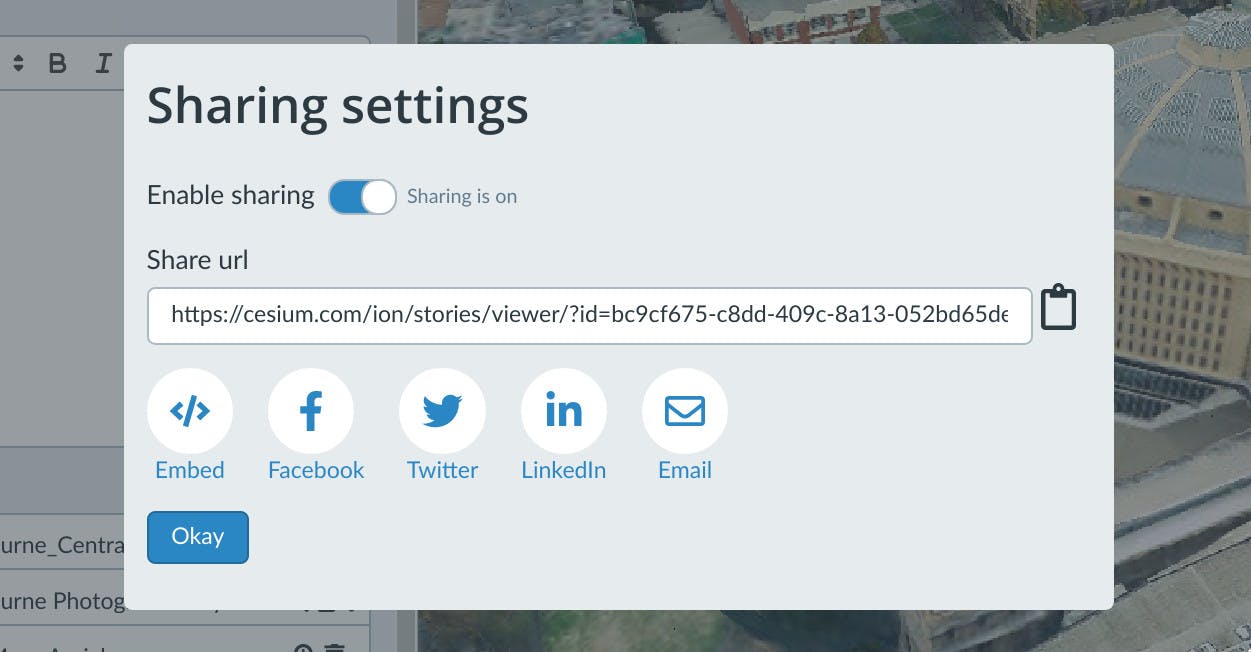
You can now send this URL to anyone to show your presentation in the Stories viewer.
You can continue to edit your story even after enabling sharing and it will retain the same URL. Your readers will automatically get the new version the next time when they reload that page.
You can easily embed your story in your web pages by clicking on the Embed button and copying that HTML code. This can be an easy way to add a 3D geospatial presentation to your WordPress site, for example.
If you would like your story to automatically play through its slides when someone views it, add the characters &play to the end of your story's URL.
You can turn off sharing at any time by clicking the Share button again and turning it off. The story link will go back to only being accessible to you.
Next steps
Congratulations! You now know how to combine different 2D & 3D datasets in a single scene, save camera views and string together a narrative that you can share on the web.
There’s a lot more that you can do with Stories. Here’s a couple ideas:
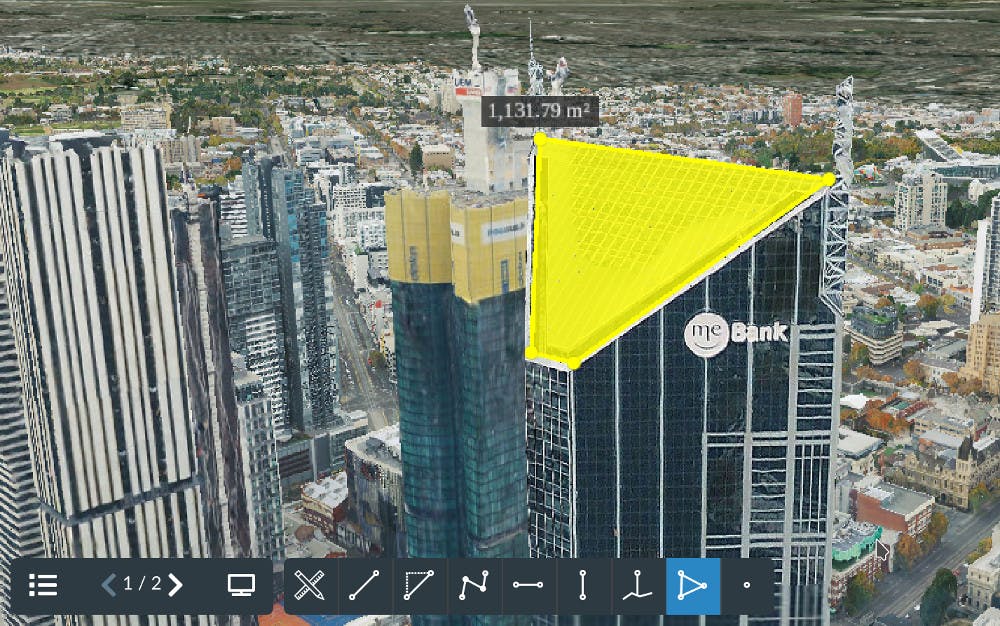
Measurements
Stories comes with a set of high-fidelity measurement tools for light-weight analysis for measuring distance, height, slope, and area. You can access these tools when presenting in the Stories viewer and clicking on the measurements icon to expand the toolbar. Here we’re measuring the area of ME bank’s rooftop:
Explore more of Melbourne’s open data
The City of Melbourne makes a lot of datasets openly available on their data portal. You can find datasets on everything from bike use, to the location of all public BBQ’s, and even all sighting of butterflies throughout the year!
If you have any feedback, questions, or made something cool that you want to share, we’d love to hear from you! Check out a full list of formats that you can upload to use in your stories.