Cesiumで可視化する軌道上AIと衛星ネットワーク ―― NTTが探る「宇宙データセンタ」アーキテクチャ
人工衛星が取得するデータ量は急速に増大している。将来的には、地球観測衛星だけでも1日あたりペタバイト級のデータが生成されるとも予測されている。こうした膨大なデータをすべて地上に送信してから処理する従来の方式では、通信帯域や地上局数の制約から限界に近づきつつある。
こうした課題に対し、NTTソフトウェアイノベーションセンタでは「宇宙データセンタ」と呼ばれるコンピューティングアーキテクチャの研究開発が進められている。この取り組みでは、人工衛星上でAI推論などのデータ処理を実行し、重要な情報のみを地上に送信することで、通信効率の向上と迅速なデータ活用を目指している。
このアーキテクチャの設計や検証を支える可視化の試みとして、Webベースの3D地球可視化エンジンであるCesiumJSが活用されている。
宇宙でAIが動く新しいデータ処理モデル
その中核の一つとなるのが、衛星軌道および衛星間通信リンクを統合的にシミュレーションできる基盤である。
従来の地球観測ワークフローは、次のような流れで構成されていた。
- 衛星が地表を観測
- データを地上へ送信
- 地上で解析・処理を実施
これに対し、NTTが検討している新しいモデルでは、
- 衛星が地表を観測
- 軌道上でAI処理を実行
- 重要な情報のみを地上へ送信
という処理アーキテクチャが採用されている。
NTTの技術展示イベント「NTT R&Dフォーラム2025」で公開されたデモでは、人工物検知アルゴリズムを用いて重要領域のみを抽出することで、送信データ量を約96%削減できる可能性が示された。
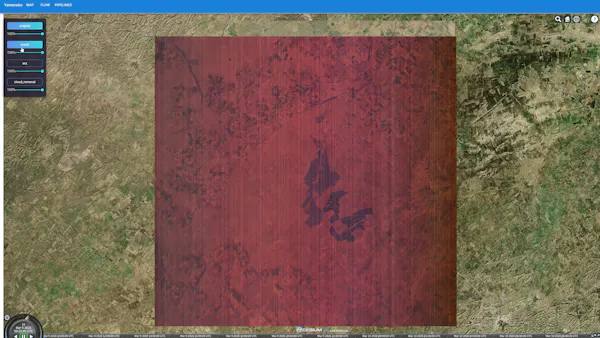
ハイパースペクトルデータ(疑似RGB画像): 衛星上で取得された観測データ(ハイパースペクトルデータ)の可視化例。(提供:NTT)
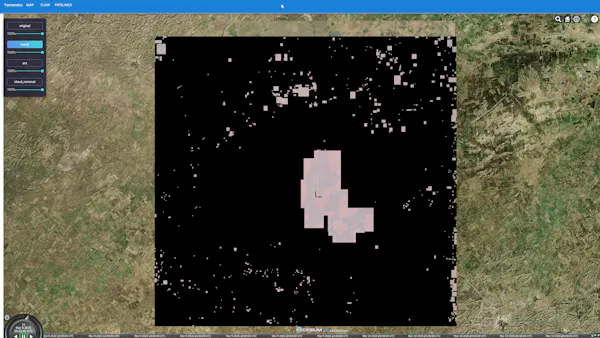
AI処理による重要領域抽出結果(データ削減後): 同データに対してAI処理を適用し、重要または異常と判断された領域のみを抽出した例。(提供:NTT)
このアプローチは単なる通信効率の改善にとどまらない。
限られた通信帯域の中で「どの情報を優先して地上へ送るか」を選別できるため、
- 災害監視
- 農業モニタリング
- インフラの異常検知
といった迅速な判断が求められる分野での応用が期待されている。
宇宙データセンタの概念を可視化したもので、衛星上でのデータ処理の様子を示している。(提供:NTT)
NTTでは、宇宙データセンタを構成する衛星群の軌道や通信リンク、軌道上でのAI処理を統合的にシミュレーションできるライブラリも開発している。しかし、衛星数やシミュレーション期間が増えるにつれて、可視化処理の負荷が増大し、研究環境の制約になるケースも見られた。
この課題に対し、NTTでは大規模な軌道シミュレーションのための可視化環境の構築・検証にCesiumJSを用いた。
CesiumJSを用いた宇宙システムの可視化
NTTが可視化の選択肢を比較検討する中で、CesiumJSのいくつかの特徴が有効であることが分かった。
- CZMLによる時間変化を伴うオブジェクト表現
衛星軌道や通信リンクを自然に表現できる - Webブラウザ上での高性能レンダリング
大規模シミュレーションでも操作性を維持できる - 地理空間データとの統合
地形や衛星画像と組み合わせて地球上の文脈で理解できる
CesiumJSを用いることで、衛星の軌道、通信リンク、観測対象地点などを3D地球上で直感的に把握できる可視化環境が実現された。
分散ネットワークアーキテクチャにおける衛星間通信リンクの可視化。(提供:NTT)
また、Cesium ionの地理空間データを組み合わせることで、宇宙空間の挙動と地球上の観測対象を同時に把握することが可能になっている。
可視化・分析レイヤとしてのCesium
本プロジェクトにおいて、Cesiumは可視化および分析のレイヤーとして機能する。
オンボード処理パイプラインの構築や、前処理・AI推論フローの設計を担っているのは、NTTが開発した low-code / no-code のパイプライン設計ツールである。
CesiumJS は、そうした処理構成や実行結果を3次元空間上で可視化・分析するためのレイヤとして機能している。衛星軌道、通信リンク、観測地点、センサー由来データやAI推論結果を地形やインフラと統合して表示することで、研究者やエンジニアはシステム全体の挙動を直感的に把握できる。
Cesiumはパイプラインを「設計する」ためのインタフェースではない。一方で、複雑な宇宙分散システムがどのように振る舞っているかを“観測可能”にし、仮説検証や異常の発見、関係者間での認識共有を支援する。
このようにCesiumは、NTTの設計ツール群と連携しながら、研究開発を加速する可視化・分析基盤として重要な役割を果たしている。
研究開発を加速する可視化基盤
可視化部分をCZMLベースの構成に整理したことで、ソフトウェア構成はシンプルになり、開発効率も向上した。
その結果、研究チームは開発開始から約2か月でプロトタイプをNTT R&Dフォーラムに展示することができた。
可視化の実装やレンダリング最適化にかかる負担が軽減されたことで、研究者はより多くの時間を、軌道計算や通信リンク成立判定、分散処理アーキテクチャ設計などの宇宙データセンタの実現に向けた中核機能の研究開発に集中できるようになった。
今後の展望
現在のプロトタイプでは、主にCZMLを用いた衛星軌道や通信リンクの可視化が中心となっている。将来的に衛星コンステレーション規模が拡大し、より大規模なデータ可視化処理が必要になった場合には、3D Tilesなどの階層的ストリーミング技術の活用も検討されている。
宇宙で処理し、地上で理解する。その橋渡し役として、空間可視化技術の重要性は今後ますます高まっていくだろう。
Cesiumでは、NTTのように新しい宇宙コンピューティングアーキテクチャを探求する組織が、複雑なシステムを理解し共有するための基盤としてCesiumを活用していることを嬉しく思います。
他の航空宇宙企業のCesium活用例についてもぜひご覧ください。
NTT Explores a Space Data Center Architecture with Cesium for On-Orbit AI and Satellite Network Visualization
The volume of data collected by satellites is increasing rapidly. In the future, even Earth observation satellites alone are expected to generate data at the petabyte-per-day scale. Under the conventional approach of transmitting all of this data to the ground before processing, limitations in communication bandwidth and the number of available ground stations are becoming increasingly significant.
To address this challenge, NTT Software Innovation Center is conducting research and development on a computing architecture referred to as the “Space Data Center.” In this approach, data processing such as AI inference is executed onboard satellites, and only important information is transmitted to the ground, with the goal of improving communication efficiency and enabling faster use of data.
As part of the effort to support the design and validation of this architecture, NTT is using CesiumJS, a web-based 3D globe visualization engine.
A new data processing model in which AI operates in space
One of the core elements is a platform capable of integrated simulation of satellite orbits and inter-satellite communication links.
A conventional Earth observation workflow has typically consisted of the following steps:
- A satellite observes Earth’s surface.
- Data is transmitted to the ground.
- Analysis and processing are performed on Earth.
By contrast, in the new model being explored by NTT, the processing architecture is:
- A satellite observes Earth’s surface.
- AI processing is executed in orbit.
- Only important information is transmitted to the ground.
In a demonstration presented at NTT’s technology showcase event, NTT R&D Forum 2025, an object-detection algorithm was used to extract only important regions, showing the possibility of reducing transmitted data volume by approximately 96%.
Hyperspectral data (pseudo-RGB visualization): Example of observation data (hyperspectral data) acquired onboard a satellite, visualized as a pseudo-RGB image. Courtesy NTT.
AI-processed result highlighting regions of interest (after data reduction): Example of applying AI processing to the same dataset, extracting only regions identified as significant or anomalous. Courtesy NTT.
This approach is not limited to improving communication efficiency alone.
Because it makes it possible to select which information should be prioritized for transmission to the ground within limited communication bandwidth, it is expected to be applicable in fields requiring rapid decision-making, such as:
- disaster monitoring,
- agricultural monitoring, and
- anomaly detection in infrastructure.
A distributed system expanding into space
The Space Data Center architecture assumes not a single satellite but a distributed system in which multiple elements work together.
For example, the following elements are involved simultaneously:
- many satellites,
- inter-satellite communication links,
- visibility to ground stations,
- changes in satellite orbits, and
- network structures that evolve over time.
Visualization of a space data center concept, showing satellite-based processing in orbit. Courtesy NTT.
NTT has also developed a library capable of integrated simulation of the satellite orbits, communication links, and onboard AI processing involved in the Space Data Center. However, as the number of satellites and the simulation duration increased, the computational load of visualization also increased, becoming a constraint in the research environment in some cases.
To address this issue, NTT conducted development and validation of a visualization environment using CesiumJS for large-scale orbital simulations.
Visualizing space systems with CesiumJS
As NTT evaluated different visualization options, several characteristics of CesiumJS proved effective:
- Object representation with temporal changes using CZML:
Orbital paths and communication links can be represented naturally. - High-performance rendering in a web browser:
Operability can be maintained even in large-scale simulations. - Integration with geospatial data:
Space systems can be understood in the context of Earth by combining them with terrain and satellite imagery.
By using CesiumJS, NTT created a visualization environment in which satellite orbits, communication links, and observation target locations can be intuitively understood on a 3D globe.
Inter-satellite communication links visualized in a distributed network architecture. Courtesy NTT.
In addition, by combining it with geospatial data from Cesium ion, it becomes possible to understand space-based behavior and Earth-based observation targets at the same time.
From visualization to a design interface
In this project, Cesium plays a central role as a visualization and analysis layer.
NTT’s low-code/no-code pipeline design tool provides the primary interface for configuring onboard processing workflows, including preprocessing steps and AI inference pipelines.
CesiumJS serves as the visualization and analysis layer that complements this design environment. By visualizing system configurations, sensor data, and processing outputs in a unified 3D context, Cesium enables researchers and engineers to intuitively
inspect, validate, and reason about complex onboard behaviors more effectively.
Rather than acting as a pipeline authoring interface, Cesium focuses on making system behavior observable.
This visualization-driven analysis shortens iteration cycles by helping researchers identify anomalies, evaluate assumptions, and communicate findings across interdisciplinary teams. In this way, Cesium provides a foundational layer that accelerates R&D while integrating seamlessly with NTT’s broader toolchain.
A visualization foundation that accelerates R&D
By reorganizing the visualization component into a CZML-based structure, the software configuration became simpler and development efficiency improved.
As a result, the research team was able to demonstrate a prototype at NTT R&D Forum, in approximately two months from the start of development.
By reducing the burden associated with visualization implementation and rendering optimization, researchers were able to spend more time focusing on the research and development of core functions required to realize the Space Data Center, such as orbital calculations, communication link validation, and distributed processing architecture design.
Future outlook
In the current prototype, visualization mainly focuses on satellite orbits and communication links represented using CZML. In the future, as satellite constellation scale increases and larger-scale visualization processing becomes necessary, the use of hierarchical streaming technologies such as 3D Tiles is also being considered.
Process in space, and understand on Earth. As a bridge between the two, the importance of geospatial visualization technology is expected to grow even further.
At Cesium, we are pleased to see organizations like NTT—exploring new space computing architectures—use Cesium as a foundation for understanding and sharing complex systems.
Please also explore how other aerospace companies are using Cesium.