Analyze 3D Reality Models with Cesium ion
Cesium ion allows you to perform analysis against 3D reality models, resulting in a classified point cloud. This guide explains how to run analysis in ion.
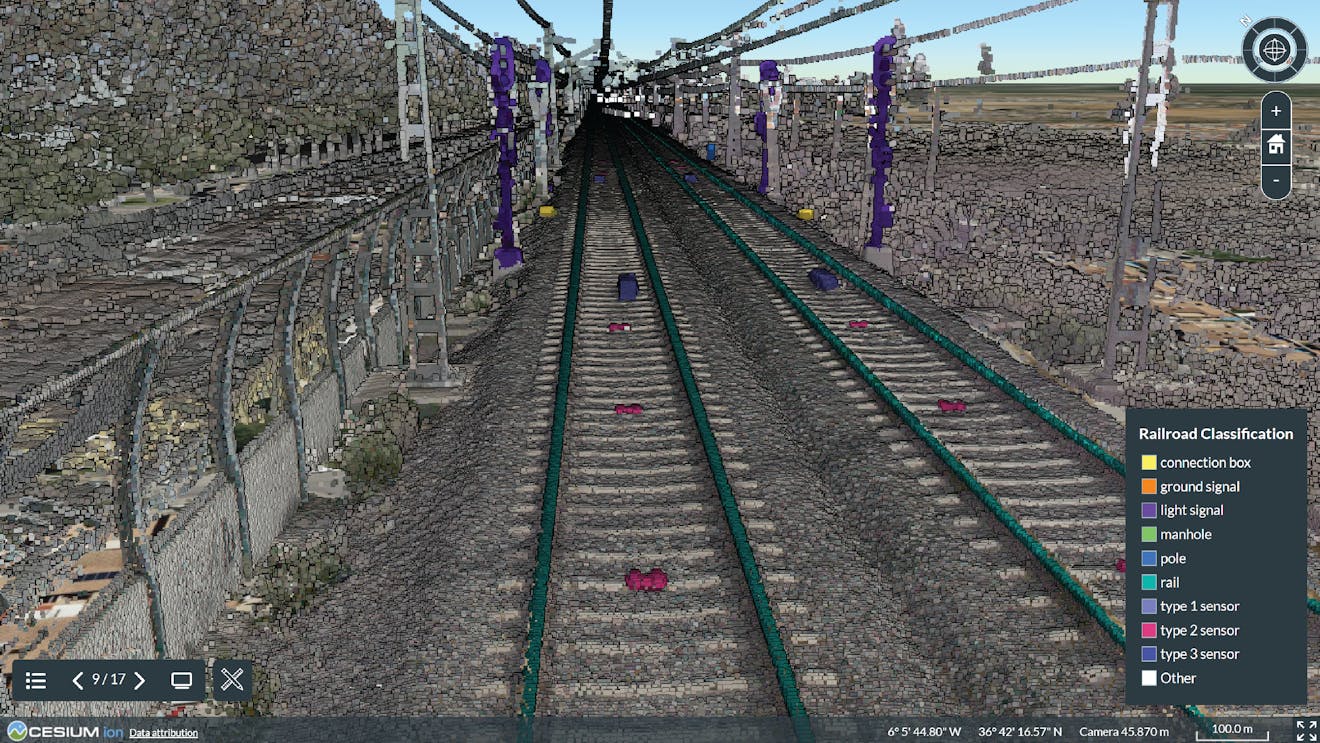
A classified point cloud of a railroad, analyzed with the Cesium ion railroad detector.
You need a Cesium ion account to take this tutorial. Sign up or log in to Cesium ion.
Cesium ion is an open platform for tiling and hosting. It will serve your reality models as 3D Tiles to any compatible client, like CesiumJS.
Cesium reality analysis is not yet available for Cesium ion Self-Hosted.
At this time, analysis requires that the input models be 3D Tiles point clouds.
Each analysis detector provided by Cesium ion is trained to identify different types of objects. For the most useful results, choose a detector that is trained for the type of objects in your reality model. If there are additional detectors you would find helpful, let us know on the community forum.
Here is a point cloud you can upload to your ion account to try out analysis: Old City Philadelphia. The city detector works well with this point cloud.
This data is provided by PASDA at https://www.pasda.psu.edu/. Pennsylvania Spatial Data Access (PASDA) is Pennsylvania's official public access open geospatial data portal.
- On the My Assets tab of Cesium ion, select a point cloud asset.
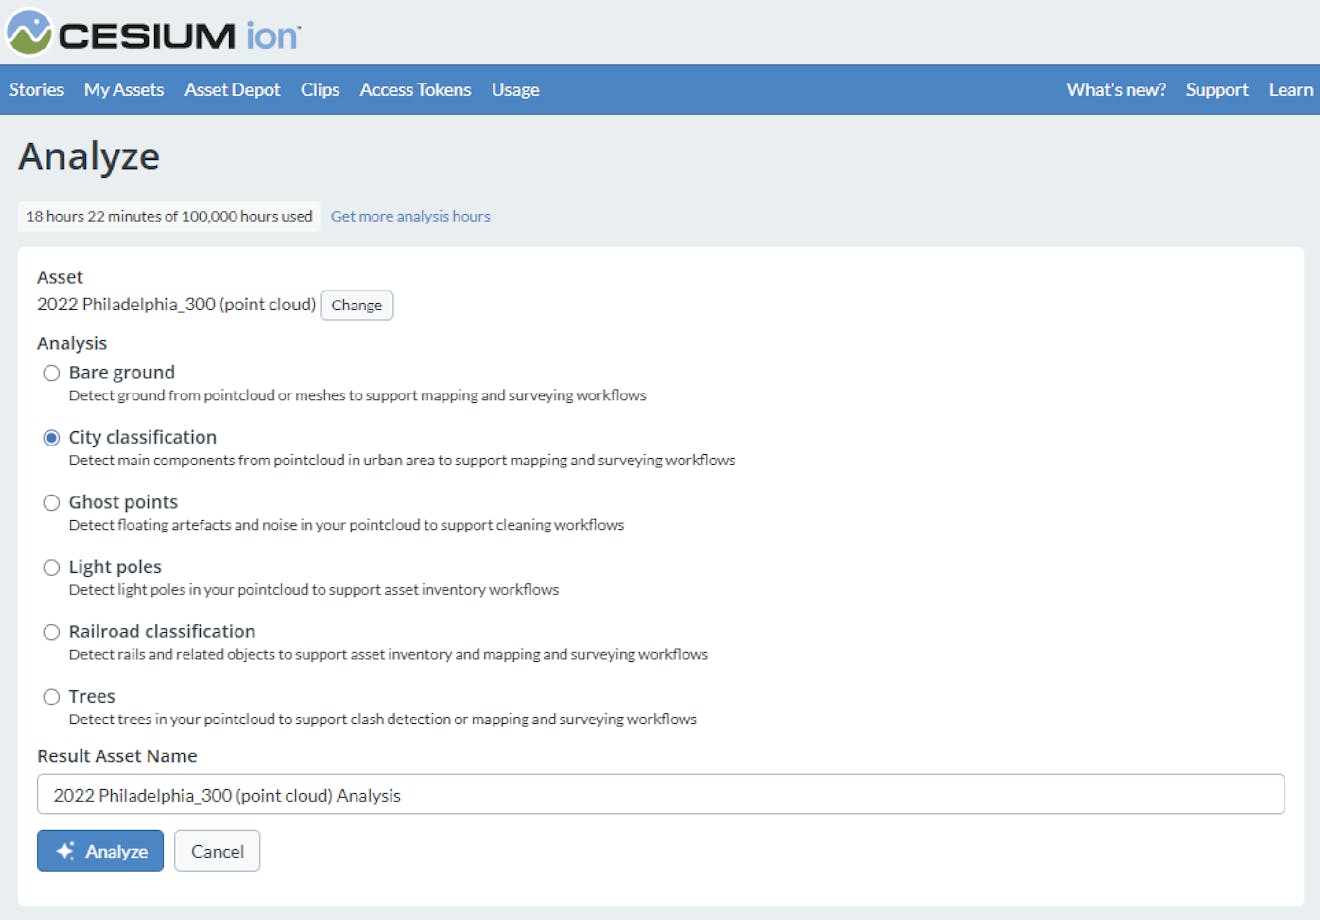
- In the right-hand panel, push the Analyze button.
- In the page that opens, select the detector you want to run.
- If desired, edit the name of the output point cloud that will be produced.
- Click Analyze.
After some time, a new point cloud asset will appear in My Assets. Select it to see the status during analysis processing.
Analysis can take considerable time, depending on the size and nature of the input point cloud and on which detector you choose.
When running analysis with Cesium ion, you can choose from a list of detectors.
At this time, ion doesn’t provide additional analysis options, such as a method to train your own custom detectors. Let us know on the community forum what would be most helpful!
The easiest way to visualize and share your reality data analysis is using Cesium Stories.
- In the Stories tab, click New Story.
- Under Assets, click the Add asset button and choose your asset.
- Click the zoom button (magnifying glass) to go to your asset in the scene. Adjust the view to your liking.
- Click Capture view to save the view. Optionally, you can use the asset style button to customize the display and labels of the point cloud. This this tutorial on how to style 3D Tiles in Cesium Stories has more information.
- Click Share and give your story a name.
You can share your data in an interactive scene! Learn more about Stories with this tutorial.
A Cesium ion Story of Philadelphia's Old City, illustrating how styling of point cloud analysis brings greater understanding.
Use your asset in a custom app
When you click on an asset in My Assets, you’ll see a preview panel on the right side of the screen.
- The preview panel displays the asset ID, which you’ll need for loading this asset in CesiumJS or other engines.
- At the bottom of this panel, you’ll find a code snippet for loading this asset in CesiumJS.
- Click Open complete code example to see your asset in Sandcastle.
- To learn how to upload your existing reality data, see the Tiling Photogrammetry Models or Tiling Point Clouds guides.
- See Create 3D Reality Models with Cesium ion to learn how to produce 3D reality models from a collection of photos.
- Check out this tutorial on how to style 3D Tiles in Cesium Stories to adjust the visualization for your 3D reality analysis data without writing code.