Advancing the Smart Construction Dashboard with LiDAR Editing
The Smart Construction Dashboard
The Smart Construction Dashboard we’ve been developing in partnership with Komatsu is at the forefront of digitally transforming the construction industry. The power of the dashboard is combining a target design—typically a CAD file—with frequent site updates like LiDAR data from drone surveys and smart construction machines. Cesium takes in these many data sources and fuses them together to give a streamable, time-tagged 3D model of the site so managers can take measurements and track progress.
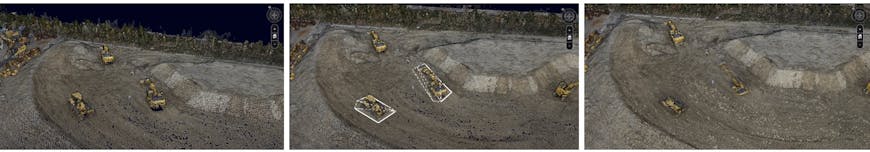
Users can edit point clouds by selecting polygon vertices around unwanted objects: initial survey (left); editing points (center); edited point cloud (right).
We’ve recently added a major new feature to the Smart Construction Dashboard: the ability to edit point cloud surveys of construction sites. This means users can now easily remove noise like vehicles and buildings to get more accurate measurements of point cloud surfaces directly in their browser.
Removing obstacles
Ideally, a drone survey would only contain data describing the surrounding terrain and exclude things like vehicles or personnel on site. Practically, this isn’t always possible. With point cloud edits, users can now draw polygons around objects to exclude them from measurements. Doing this in a full 3D engine gives users complete control over exactly how these edits are done. For example, when removing a vehicle on a small mound of dirt, users can ensure that the terrain is preserved by selecting polygon vertices on the elevated area around the vehicle. Doing so will remove the vehicle while keeping the slope and elevation of the surrounding surface intact.
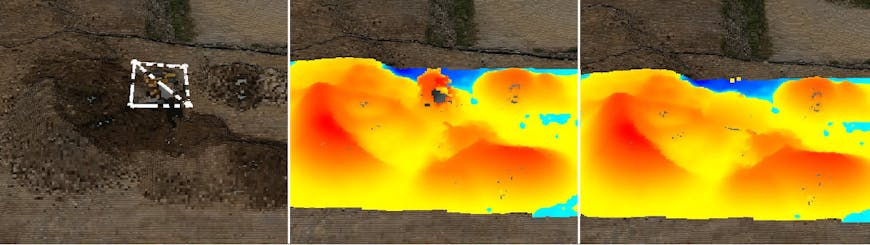
Removing noise from point cloud surveys yields more accurate volume measurements: identify area to flatten (left); volume cut & fill before edit (center); volume cut & fill after edit (right).
An accurate picture in less time
We’re already seeing how this workflow saves site managers hours of time and effort. There’s no longer a need to manually compute and subtract volumes of individual areas from the total volume result. Since everything is done in our Dashboard, there is also no need to use additional software to maintain separate versions of surveys for analysis. Site staff can review edits made to a survey and even undo any individual edit if it is incorrect. This makes collaboration on Dashboard projects much easier.
To build your own applications for exploring point clouds in context, start using the Cesium platform for free.