Visualize underground utilities, mines, and geological layers with Cesium
This month’s CesiumJS release introduced key improvements that enable visualizing underground data. This allows you to seamlessly transition from above ground features like entire cities to what’s underneath in the same scene, whether that’s utility data like water pipelines and electricity cables, or 3D structures like caves and mines.

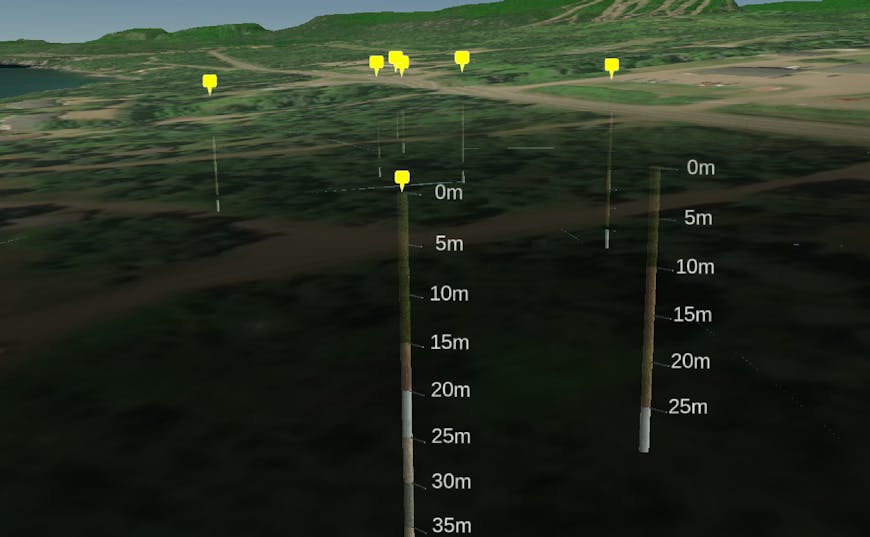
Visualizing boreholes with the different ground materials along its depth. Data from the Borehole Geophysical Database of the University of Minnesota.
Being able to fuse subsurface data with 3D terrain and other layers in CesiumJS means you can visualize all the relevant information in one place without the need to continually switch between specialized tools. For example, you could visualize earthquake occurrences over time and measure their proximity to critical urban infrastructure by adding Cesium OSM Buildings to your scene.
Visualizing earthquakes over time in the Sawtooth Mountains in Central Idaho through April and May 2020. Each sphere contains metadata on the magnitude and depth of the earthquake center, as well as any recorded error margins
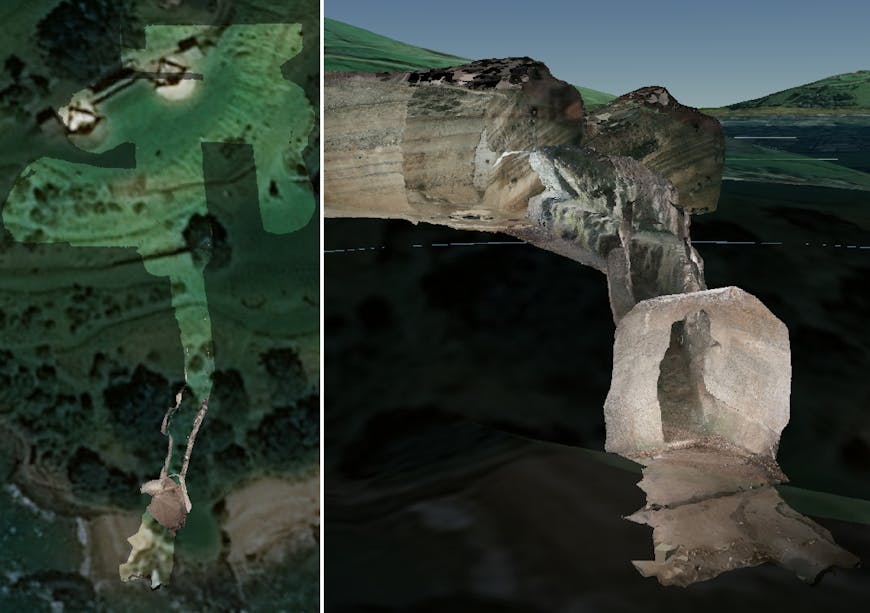
You can control how your underground data is visualized using the CesiumJS API. Below, we’re visualizing photogrammetry of a tunnel. By keeping the ground mostly opaque, we can see exactly which parts are above ground (just the entrance) and how far the structure extends. We can also configure the camera to hide the ground when zooming in close so we can walk inside this tunnel without interference.

Photogrammetry of old military tunnel at North Head, Auckland, New Zealand. Left: keeping the ground mostly opaque to see which parts of the structure are above ground. Right: hiding ground close to the camera to allow the user to walk inside the tunnel. Captured by b_nealie.
Try it out
Upload your underground data to Cesium ion or see the code examples below to learn how to enable these features in your Cesium app:
- Enable globe transparency
- Enable transparency only on a section of the ground
- Customize the look of underground scenes
If you have any questions or want to share what you’re working on, let us know on the forum!