Vricon + Cesium - Partnering to provide accurate 3D content in the cloud
We’re teaming up with our friends at Vricon to provide their amazing 3D digital surface models through Cesium ion, starting with highly detailed datasets for six cities. This announcement comes during the GEOINT Symposium, and many of these locations are of interest to the defense and intelligence community.
Vricon collects incredibly accurate photogrammetry data of the most hard to capture places in the world. 3D Tiles was made for massive-scale high-precision rendering for just this type of data, so the accuracy of Vricon’s data - 50 cm with an absolute accuracy of 3m - is preserved when rendered in CesiumJS or any application that supports 3D Tiles.
Flying over the Great Pyramid of Giza in CesiumJS with Vricon's 3D Surface Model tiled as 3D Tiles.
We’re excited about this because it means developers can access high quality 3D content to use in their applications with just a few clicks. All you have to do is login or sign up for an ion account, and head over to the Asset Depot to start streaming these 3D Tilesets to your applications on any device.
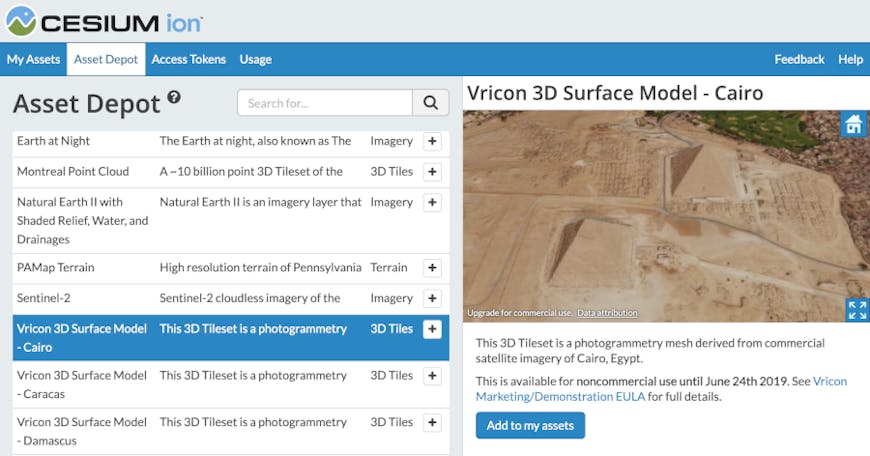
You can access Vricon’s 3D Surface Models in Cesium ion’s asset depot. Click “Add to my assets” to start using it.
3D Tilesets of the following six cities are available to Cesium users - free for non-commercial use for 3 weeks, until June 24th:
- Cairo, Egypt
- Caracas, Venezuela
- Damascus, Syria
- Tehran, Iran
- Honolulu, HI
- San Francisco, CA
This marks the beginning of a larger partnership with Vricon where we’ll provide access to more of their 3D photogrammetry data in Cesium.
Highlighting areas of interest
As an example of what 3D Tiles enables with this kind of data, we put together a demo we’ll be showing off at our booth (727) at GEOINT. We can easily combine this high resolution photogrammetry with vector data from surveys of local worship sites in Damascus provided by Spatial Networks.
This allows us to immediately see these areas of interest and click on them to see metadata like the year it was built and whether this mosque serves any alternative uses in the community:
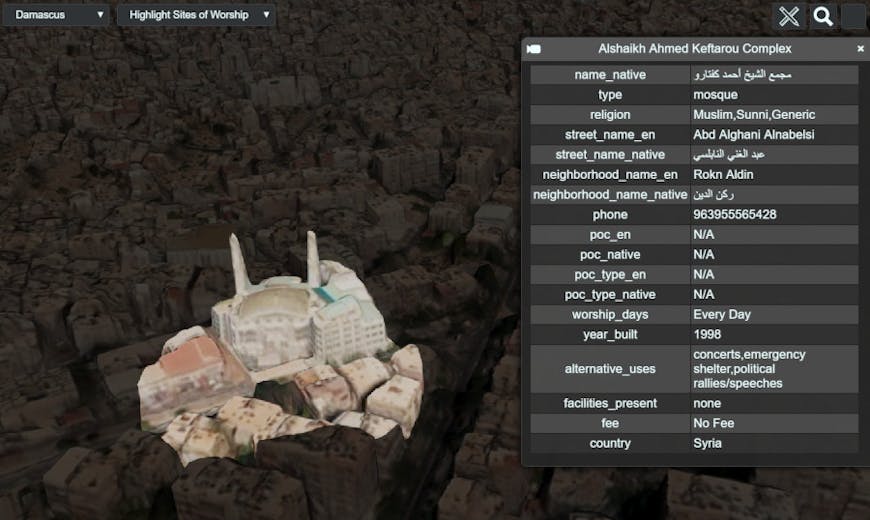
Highlighting a mosque in Damascus in 3D Tiles with vector data provided by Spatial Networks.
We can easily filter these areas by any metadata fields. For example, we can highlight just the mosques that are known to be used for political rallies, or highlight churches in blue and mosques in green to get an idea of their distribution and proximity at a glance:
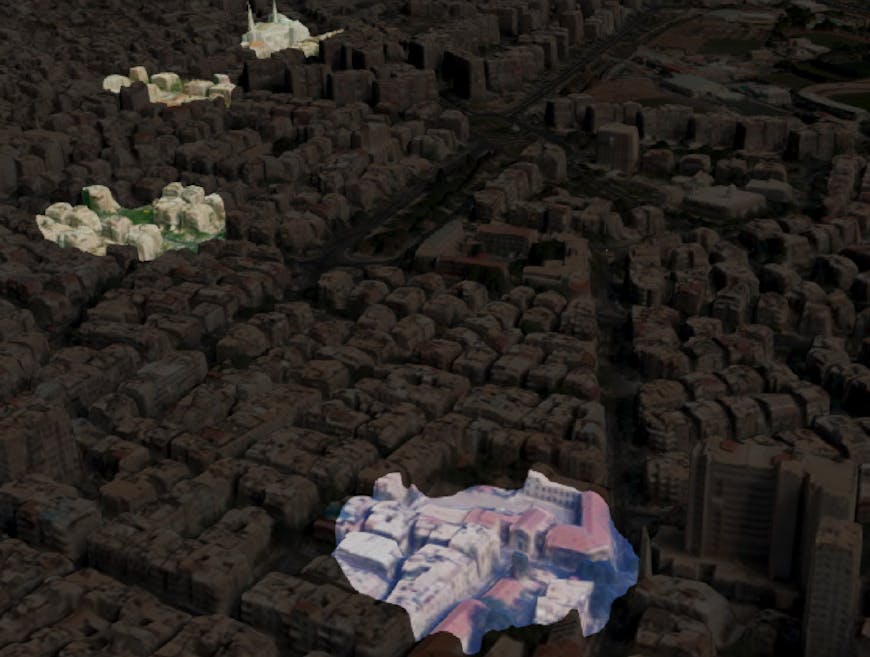
Highlighting churches in blue and mosques in green makes it easy to see their distribution and proximity across the city of Damascus.
This demo also uses the Cesium ion Analytics SDK which makes it easy to take measurements of any given area:
We’d love to see what you build with this data -sign up for an ion account to get started. If you’ve never used Cesium before, the getting started guideis a great place to start. If you have any questions, don’t hesitate to reach out to me at patrick@cesium.com.
It also shows off how you can visualize sensor visibility in real-time:
Computing the drone's visibility in real-time with the Cesium ion SDK, flying over Honolulu.
We’d love to see what you build with this data -sign up for an ion account to get started. If you’ve never used Cesium before, the getting started guide is a great place to start. If you have any questions, don’t hesitate to reach out to me at patrick@cesium.com.