NORAD Santa Tracker Technology through the Years
Since 2012, Analytical Graphics Inc. has used Cesium and Bing Maps to build a 3D web map for NORAD Tracks Santa, a popular website that allows users to visualize and follow Santa’s journey around the globe on Christmas Eve. During the month of December each year, NORAD Tracks Santa receives over 22 million unique visitors.
NORAD Santa Tracker History
So how did it all begin? The story behind the NORAD Santa Tracker started with a happy little mistake more than 60 years ago. In December 1955, a Sears department store ad in the local newspaper listed a phone number and encouraged children to call Santa. The ad read, “Call me on my private phone and I will talk to you personally any time day or night, or come in and visit me at Sears Toyland. – Santa Claus”.
A child attempting to call Santa instead reached Colonel Harry Shoup at the North American Air Defense Command Operations Center. North American Aerospace Defense (NORAD) monitors the airspace above the United States and Canada and responds to unknown, unwanted, and unauthorized air activity to prevent air attacks against North America. Inspired by this child’s call, NORAD began monitoring the flight of Santa’s sleigh, and a tradition was born. Ever since, children have been able to call in to the Santa Tracker hotline to find out where Santa is on his Christmas Eve journey.
Santa Takes to the Web
In 1997, Analytical Graphics, Inc., took Santa tracking to the web. Children no longer need to call NORAD directly to check on Santa’s progress: they can look it up online at any time by checking Santa’s position on a map. The NORAD Tracks Santa site was wildly popular by the standards of those early internet days and crashed when 100 people tracked Santa at the same time. Of course, the site can (and does) handle much more traffic now.
Using Cesium’s Mapping Technology
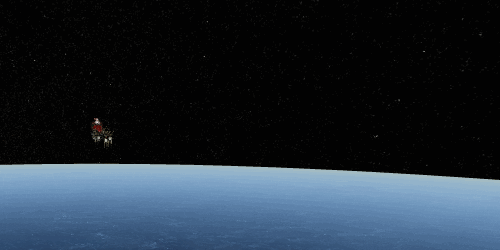
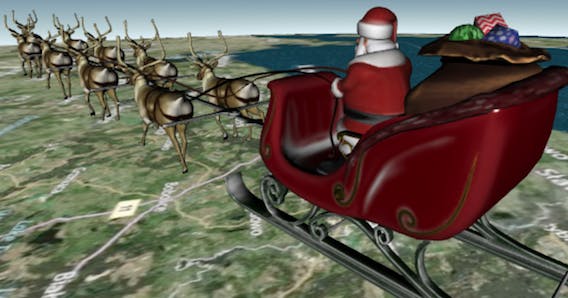
In 2012, AGI partnered with the Cesium team to build a 3D web map for visualizing Santa’s location as he made his way around the globe. With Cesium, children could see Santa’s current position in the air as he flew around a 3D globe complete with global terrain and satellite imagery. Billboards, or flat signs that face the camera, drew attention to locations Santa visited, and when users clicked on a location, they were able to view videos of Santa, as well as Wikipedia articles about the selected area.
At that time Cesium was in its very earliest stages&it was still in beta!& but even then it gave children a seamless, immersive, interactive view into Santa’s flight. Cesium is an open-source virtual globe and map engine originally designed for aerospace applications where visualizing precise geographic and temporal locations is critical. Cesium is built on WebGL, a standard for rendering interactive 2D and 3D graphics in a web browser that was itself a brand new technology at the time; the Khronos Group had just released version 1.0 of the WebGL specification in 2011. Because Cesium is built on WebGL, it is cross platform-friendly (including Chrome, Firefox, Internet Explorer, and Safari), can run on a wide variety of devices including mobile, and doesn’t require a plug-in.
So what’s the magic behind the map? The Santa tracker updates Santa’s location and puts icons on the globe at locations he has already visited using CZML packets. CZML is an open specification developed by the Cesium team for describing time-dynamic 3D scenes. Using the latest information about Santa’s location provided NORAD, AGI’s STK Components generates new CZML packets, which are then streamed into the Santa tracking map.
The map uses Bing satellite imagery; Microsoft is one of the major partners in this effort.
The terrain dataset is STK World Terrain, which is generated from a variety of open data sources, such as GTOPO30, NED (National Terrain Dataset), and SRTM (Shuttle Radar Topography Mission), using AGI’s STK Terrain Server. The STK Terrain Server takes the raw data formats and processes them into the quantized mesh format, an open specification developed by the Cesium team for faster terrain tile streaming on the web.
Santa Becomes Animated
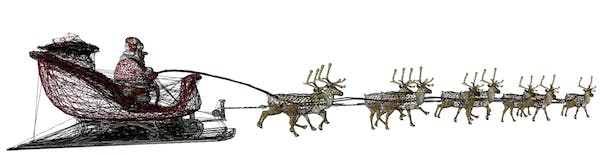
In 2013, Santa and his reindeer became a bit merrier as they were animated in 3D for the first time. Artists created the models in Modo, which were then converted to glTF so they would render efficiently on the web. glTF, the GL Transmission Format, is an open-standard runtime asset format developed by the Cesium team and the Khronos Group, a consortium that creates open standards for computer graphics. Think of glTF as the JPEG of 3D.
Thanks to efficient web rendering, anyone could watch Santa, his sleigh, and nine prancing reindeer flying around the world without delay.
Over the next few years, the Cesium team brought techniques from graphics research, the movie industry, and the game industry to bring appearance and performance improvements to the Santa Tracker, enhancing users’ experiences.
Every December, NORAD Tracks Santa gets around 20 million visits. Not only can children and parents watch Santa make his annual trek using state-of-the-art mapping technology, but through the site they can also access interactive games, activities, videos, and so much more. Stay tuned to the Cesium blog for details on the new features coming to the NORAD Santa Tracker this year!