NORAD Tracks Santa Tech Preview
As part of the NORAD Tracks Santa ® team, Analytical Graphics, Inc. is using Cesium to build a 3D web map for visualizing Santa’s location on December 24th as he makes his way around the globe. See it in action on Christmas Eve at www.noradsanta.org.
In this post, I’ll share the tech behind the 3D web map. The locations used in the screenshots are based on test data; we, of course, won’t know Santa’s route until NORAD starts tracking Santa on Christmas Eve.
Cesium and WebGL
We developed the map app using CesiumJS, an open-source virtual globe and map engine, which itself is built on WebGL, an open standard for 3D graphics - basically OpenGL ES 2.0 for JavaScript. WebGL is available on most modern browsers, including Chrome and Firefox, and on all major desktop operating systems: Windows, Linux, and Mac.
What this means is that users can get 3D in their browser without needing to install a plugin or having administrator privileges. As long-time C++ developers, this is one of the main reasons we started using WebGL. For NORAD Tracks Santa, this is the first time users can track Santa in 3D without a plugin.
Let’s look at how we draw each part of the app.
Land
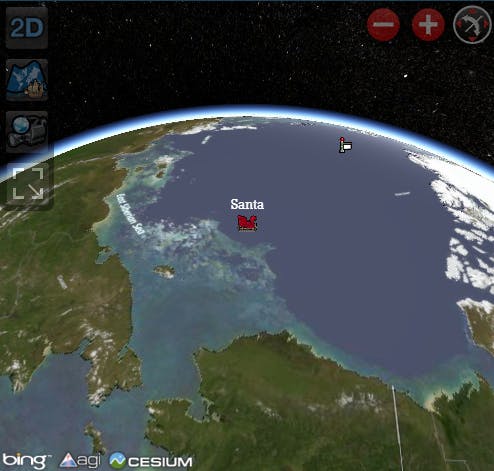
The globe is modeled accurately using the WGS84 Ellipsoid, not a sphere. Global terrain data was derived from the Shuttle Radar Topography Mission (SRTM), which has 90-meter spacing between -60 and 60 degrees latitude, and the Global 30 Arc Second Elevation Data Set (GTOPO30), which has 1-kilometer spacing for the entire globe. Since these original datasets are huge, we preprocess them into a hierarchy of heightmap tiles using the Tile Map Service (TMS) layout.
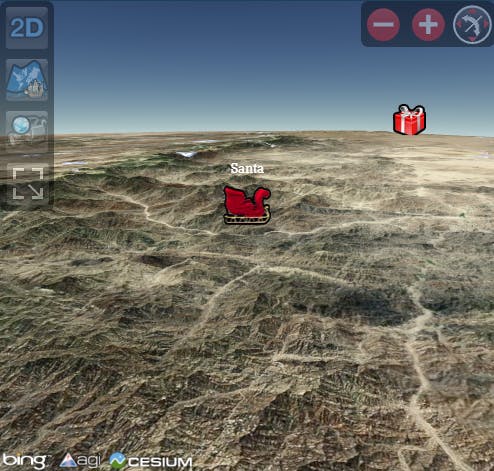
Cesium asynchronously requests tiles to draw based on the current view, so only a small subset of the dataset is sent to the client. The requested tiles are determined using hierarchical level-of-detail (HLOD) so lower-resolution tiles are requested farther away from the viewer, view frustum culling so tiles outside of the view are not requested, and horizon culling so tiles over the horizon are not requested. To minimize stalls when new tiles are received, Cesium creates a mesh from the heightmap tile in a web worker, so the main thread can continue issuing WebGL calls. Tiles are, of course, rendered with backface culling so hidden triangles facing away from the viewer are not rasterized or shaded.
The high-resolution imagery laid on top of terrain is streamed from Bing Maps, thanks to Microsoft who is also part of the NORAD Tracks Santa team. Imagery is tiled and requested similar to terrain. However there is not a one-to-one relationship between terrain and imagery tiles so Cesium generates multiple fragment shaders, where each supports a different number of image tiles on a terrain tile. Of course, true dynamic branches in fragments would be useful here, but sorting-by and switching shaders is still much better than the multi-pass alternative. To improve visual quality for horizon views, anisotropic texture filtering is used when it is available.
Both heightmap and imagery tiles are cached, and the least recently used tiles are freed to make room for new ones.
Water
To render water at a global scale, we derive a water mask from the same SRTM and GTOPO30 data used to render terrain. To minimize the number of requests (and we expect a lot of requests when tracking Santa), we include the water mask in heightfield tiles as an array of bytes where 1 is water and 0 is land. Most tiles are all water or all land, of course, which gzips well. We pre-gzip all tiles to reduce server-side processing when tiles are requested.
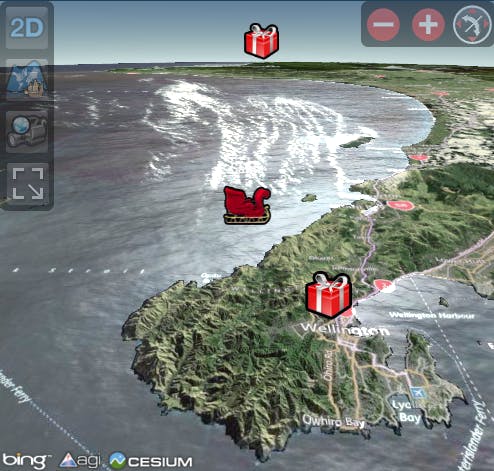
Given the water mask, the fragment shader used to draw the globe knows if it’s shading land or water. For animated water, the ellipsoid surface normal is perturbed by several time-dependent reads to a normal map to create the effect of waves, based on Jonas Wagner’s WebGL Terrain, Ocean, Fog demo. The water color is then blended with the high-resolution imagery from Bing Maps so labels show through.
Sky and Space
The sky atmosphere providing the white-to-blue halo ground the globe approximates atmospheric scattering in a vertex shader using Sean O’Neil’s work from GPU Gems 2, Accurate Atmospheric Scattering.
Stars are drawn by rendering a sky box around the entire scene. To minimize our data requirements, we draw the sky box using a True Equator Mean Equinox (TEME) to pseudo-fixed transform, instead of more accurate Inertial transforms that require extra data. The stars dataset is from NASA. The original image was converted into six separate images, one for each side of the sky box, and JPEG compressed at 80% quality to reduce bandwidth and startup time.
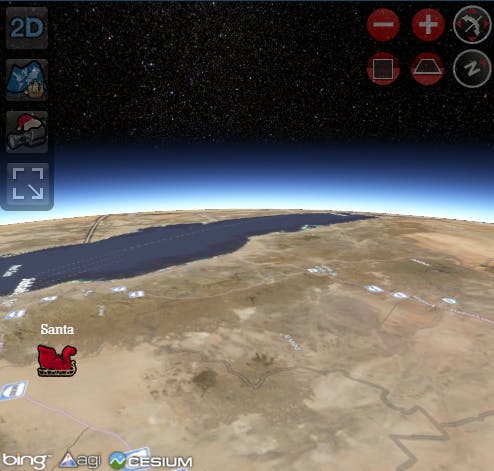
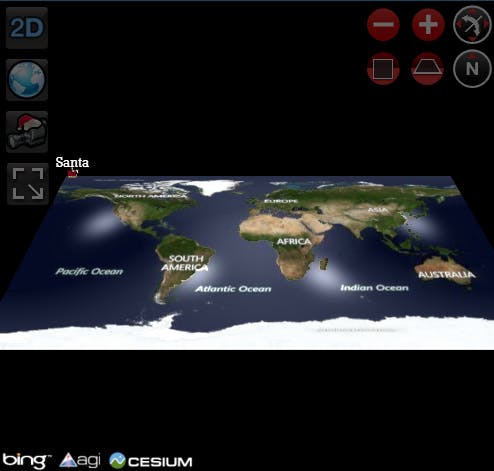
Columbus View
In addition to the 3D globe, users can morph into a 2.5D flat-Earth view we call Columbus view. A vertex shader is used to morph between views so the scene actually animates during the morph.
Rendering Pipeline
Rendering a global-scale scene leads to precision problems. Perhaps the most common is z-fighting, where nearby objects or parts of objects flicker back and forth. This is due to the perspective transform and large near-to-far ratios required by global-scale scenes.
To solve this, Cesium renders with multiple frustums. First a large frustum with the minimal near and maximum far plane is used to render the sky box, followed by the sky atmosphere, both with depth writes disabled (yes, this totally violates the mantra of render the sky box last). Next, we iterate over all renderable objects in the scene which return draw commands that include the object’s bounding volume, shader, vertex array, render state, etc. While doing so, we cull objects outside of the view frustum and beyond the horizon, and determine the minimum near distance and maximum far distance of the remaining objects. We then decide how many frustums we need to render these objects maintaining a reasonable near-to-far plane per frustum, and drop objects into buckets for each frustum (an object could be in more than one frustum). As an optimization, we exploit temporal coherence, and try to use the frustums computed for the previous frame before computing new ones to save a pass over the objects. Finally, we walk the frustums back to front, clearing depth before each one, then issuing the draw commands for each object in the frustum.
Billboards that represent Santa, the North Pole, and presents, are batched together and issued as a single draw call. Although there are only a handful of unique icons, they are combined into a single texture atlas to enable batching. Billboards are dynamically sized in the vertex shader based on the view distance.
Flights
Camera flights are used throughout the app. The camera flies from a global view to Santa when the app first starts, and flies to a city when the corresponding icon is clicked. Two splines are used: a Hermite spline determines the camera’s position, and spherical-linear interpolation determines the camera’s orientation.
Other Goodies
Using the Fullscreen API, our app allows users to enter full-screen mode, which I really recommend. For users with old video cards or browsers not supporting WebGL, we fallback to a 2D map using Bing Maps, which still has a number of features of the 3D version like the ability to click on a city icon and see a Wikipedia popup.
In these final weeks leading up to Christmas Eve, we are still tweaking the app - adding optimizations, robustness for different video cards, and improving the user experience. We’ll write an update to this post with the interesting stuff.
Check out our app yourself on December 24th at www.noradsanta.org.