The Tech Powering NORAD Tracks Santa
On Christmas Eve, children can follow Santa Claus’s journey with NORAD Tracks Santa® on a globe built with Cesium. Every year I’m responsible for updating and running NORAD’s Santa Tracker, which is visited by more than 20 million children and parents each Christmas. It’s one of the best things about my job as a developer at Cesium.
So how does it all work? This post walks through the tech that powers the Santa Tracker app. You can find a more technical overview here.

I love working on the technology that brings Christmas magic to so many children.
Tracking Santa with NORAD and Cesium
The North American Aerospace Defense Command (NORAD) protects the United States and Canada by monitoring objects in air and space. One of those objects is Santa’s sleigh—since 1955, children have been able to call NORAD on Christmas Eve to find out where Santa is at that moment. And since 2012, they have been able to see Santa’s location on a 3D globe built with Cesium.
CesiumJS is an open-source library for visualizing geospatial data. Cesium is used to create all kinds of custom applications, including NORAD’s Santa Tracker.
Cesium was originally developed to track satellites. It’s designed to efficiently stream huge amounts of highly precise data on the web, like AGI’s interactive, web-based satellite viewer, SpaceBook, which shows more than 15,000 space objects, updated in near real-time.
Throughout Christmas Eve day, we update a virtual Earth with Santa’s real-time location from NORAD. The technology used to create the app works very similarly to modern video games. Our virtual Earth is made up of several pieces: 3D terrain, satellite imagery of the land and sea, lighting from the sun, a map of the stars. We then add a model of Santa Claus and update his position as we get updates from NORAD’s network of Santa-tracking sensors. And we add some finishing touches of snow.
The world
The Santa Tracker starts with a virtual Earth made up of two main pieces: terrain and imagery.
Rudolph leads the way for Santa and his sleigh.
Terrain
Terrain elevation data is collected in a variety of ways, including radio radar sensors on satellites and laser lidar sensors on drones. The terrain on the Santa Tracker globe was combined from a variety of elevation datasets made publicly available by city and government agencies, including NASA and the United States Geological Survey.
We create that terrain on the globe with a 3D mesh of triangles depicting mountains, valleys, hills, canyons, and other land features.
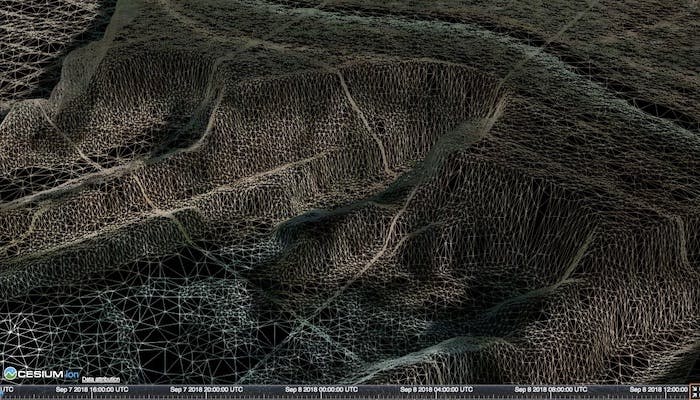
The underlying terrain triangle mesh for Montaña de Oro, California. This dataset is in Cesium World Terrain, our high-resolution global terrain tileset, which has 50 cm resolution here.
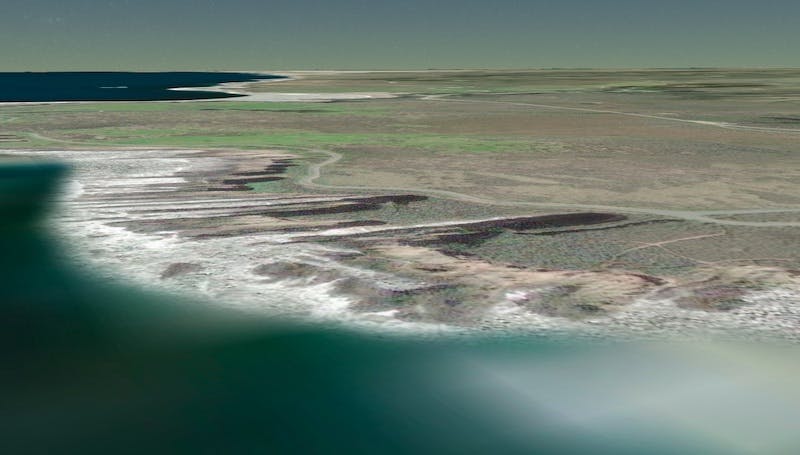
Satellite imagery on a 3D globe without terrain isn’t very 3D.
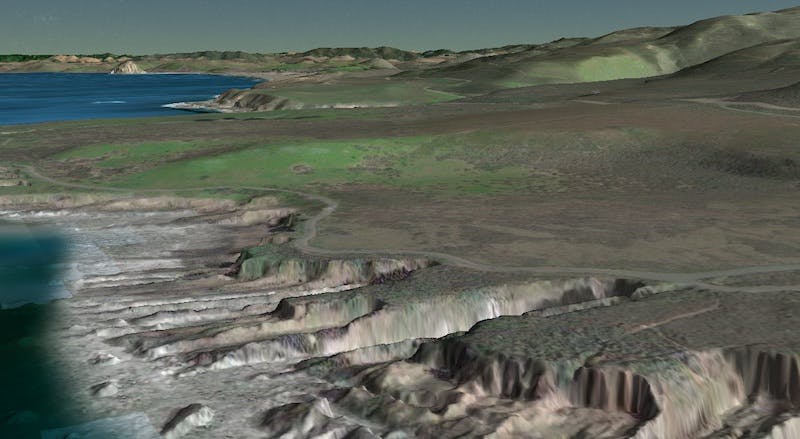
Satellite imagery over terrain at Montaña de Oro. Imagery combined with terrain creates a 3D virtual Earth that represents the real Earth.
The Santa Tracker app uses Bing Maps imagery. To create imagery like this, satellites collect millions of pictures of the Earth. The pictures are processed to weed out ones with too much cloud cover, color corrected so all of the pictures match, and stitched together to create a seamless imagery layer.
The app would crash if we tried to load all the imagery for the entire world at once. We solve this problem with a level of detail technique to request only the images needed based on what the user is looking at. Each level of detail is made up of more images at a higher resolution. The lowest level of detail is made up of two or four low resolution pictures: one or two for the western hemisphere and one or two for the eastern hemisphere. Each image is divided into four sections and replaced by higher resolution images to create the next level of detail.
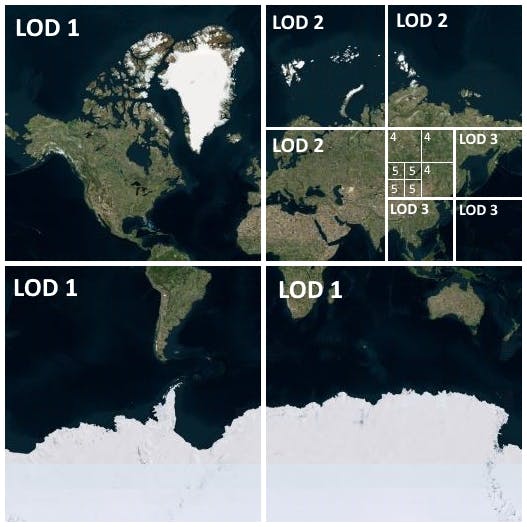
As you zoom in, the next level loads and replaces one of the lower resolution images with four higher resolution ones. This allows you to see the whole globe when zoomed out and fine details when zoomed in.
New levels of detail load as we zoom in.
The sun and the sun’s reflection in the ocean move with time.
Our virtual Earth is placed inside a star map created from images generated by NASA based on their Tycho and Hipparcos star catalogs. To display the stars around the Earth, we build a cube map comprising six images.
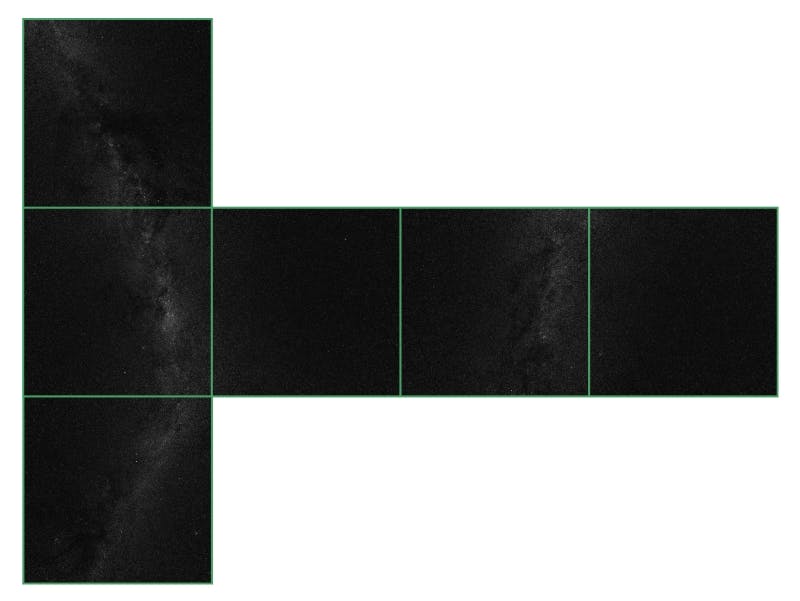
These six images of Cesium’s star map make up the six faces of a cube.
The images fit together seamlessly to create a sky box. The Earth sits inside of the sky box, so we see a seamless starry background in every direction. Both the star map and the sun move as time passes to give us the full picture of Earth’s position in space.
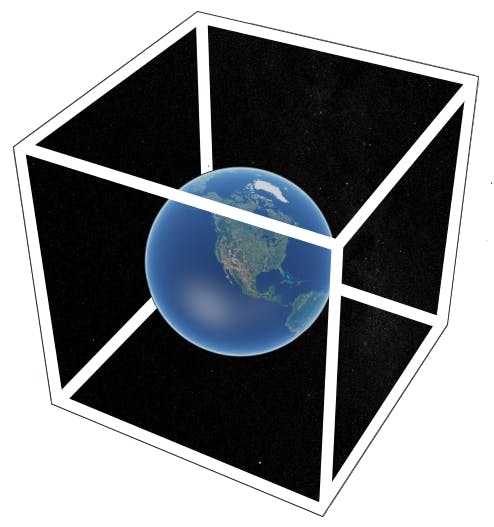
Placing the Earth inside of the sky box creates the background of stars.
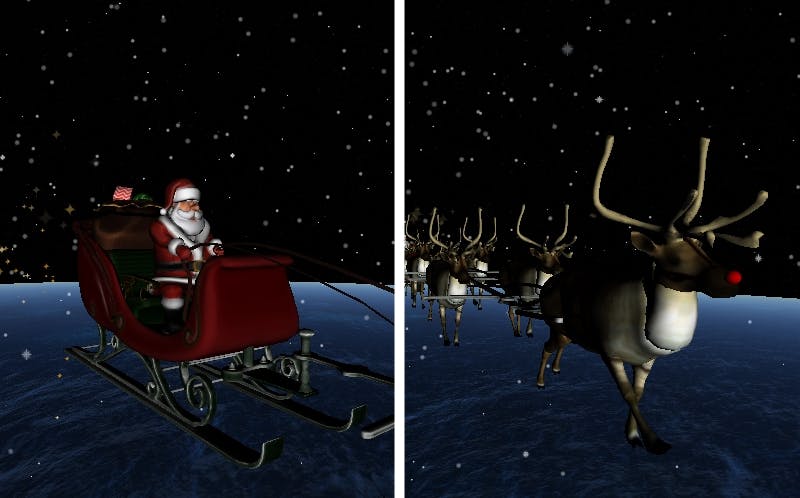
Santa’s sleigh and his flying reindeer.
The artist started with a drawing, then used Modo, a modeling program, to create the shape of Santa and his reindeer. Like terrain, 3D models are represented as a mesh of triangles.
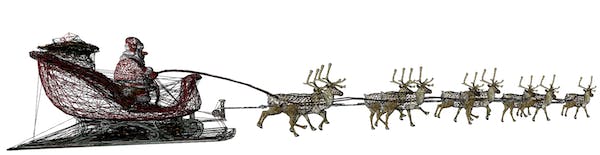
A peek at the 26,762 triangles that make up this model.
The artist painted the mesh with textures and colors to add details like the reindeer fur and the shiny red sleigh.
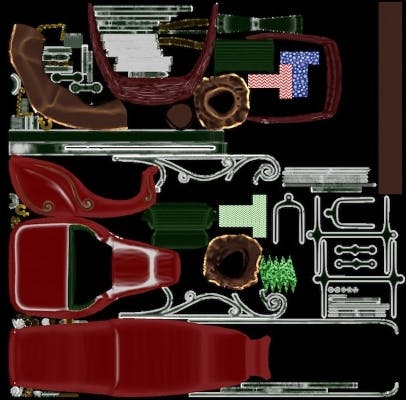
The colors are saved as a flat image that wraps around the triangle mesh, just like satellite imagery wrapped over the terrain on our virtual Earth.
Finally, the artist creates animations to make certain parts of the model move.
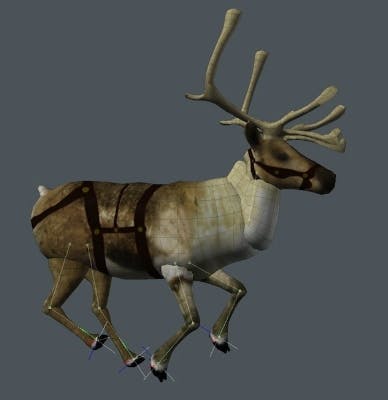
The artist positions the reindeer legs to make him gallop.
There’s even snow
We added lots more finishing touches to the app. For example, since we’re all dreaming of a white Christmas, we added snow to the app using a particle system.
Particle systems are often used for special effects in video games. A particle systems is a collection of images that are updated every frame following rules that define their position, color, and size. We created a snow system surrounding Santa and his reindeer, as well as a trail of sparkles following his sled.
Snow and sparkle particles generate around Santa.
The snow particles first appear as transparent and then transition to white. They also shrink in size over their lifetime, so they naturally fade in and out of view and appear as a gentle snowfall.
Snow particles become more translucent as you zoom away from Santa.
The 3D Santa Tracker goes live on December 24 once the countdown reaches zero! When you follow Santa this Christmas, watch for the pieces that make the app work. Maybe you’ll be inspired to develop your own custom app.