1.1 Million 3D Buildings in New York City with 3D Tiles
Using 3D Tiles we’ve visualized a truly massive dataset: 1.1 million buildings in New York City.
Where did the data come from?
As part of a new open data initiative, the NYC Department of Information Technology and Telecommunications recently made available a CityGML dataset for the city. We also converted a tileset from Open Street Map data of New York City, which includes object descriptions and metadata for each feature.
How is it visualized?
We wanted to show this data in 3D, but the original dataset was intended for archival and interop purposes, not visualization. We started by reconstructing a 3D model for each building based on its metadata. This resulted in 1.1 million individual model files.
We then tiled this data into 3D Tiles and created an app to visualize and interact with the datasests.

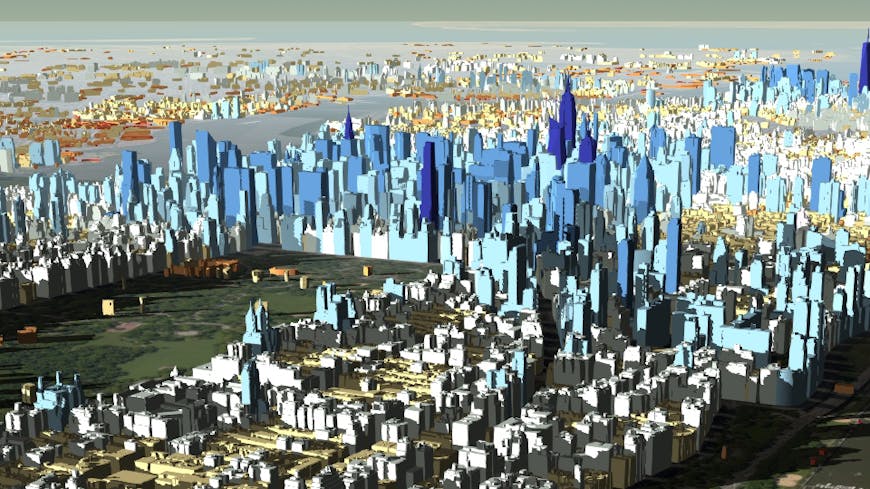
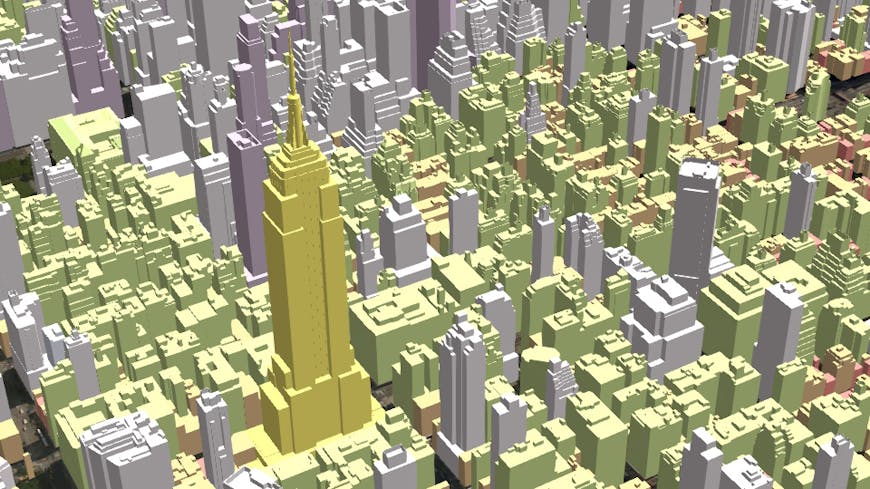
Color buildings by attributes such as height. This stlying is computed on the fly and doesn’t have to be “baked in” to the dataset. We can also use a slider to selectively hide buildings below a certain height.
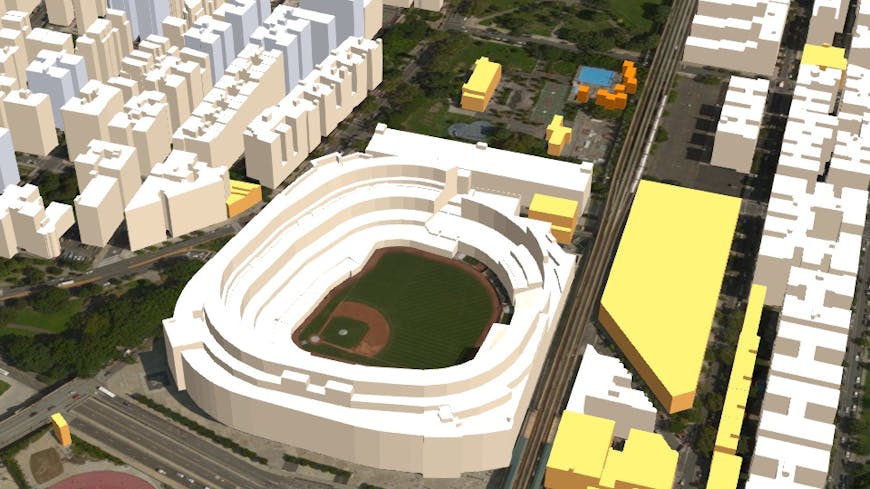
You can interact with the data in the app by clicking on buildings to view their metadata.
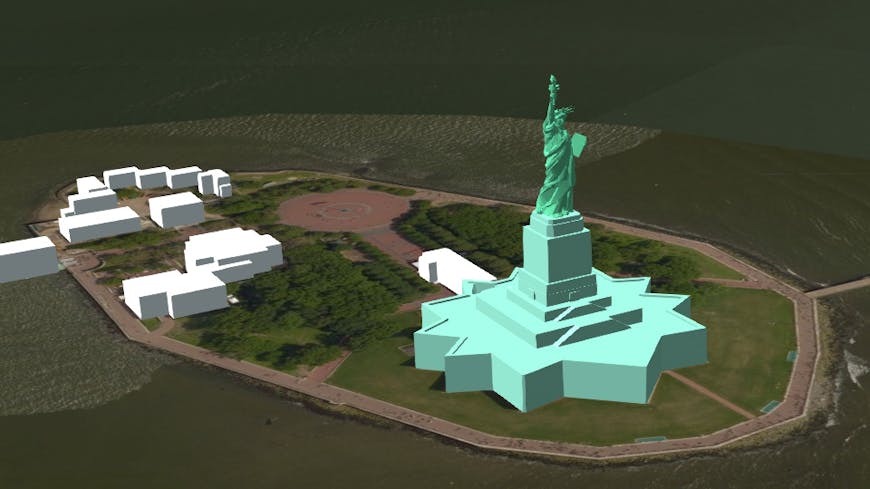
Zoom to and select various points of interest.
Why 3D Tiles?
Prior to 3D Tiles, most data and formats for geospatial were 2D only. What 3D was available was either not web-friendly or not designed for 3D visualization.
With glTF, an open model standard published by Khronos that we helped create, we could represent single buildings, trees, and small point clouds. But that still left a big-data sized hole in our needs. 3D Tiles is the missing link between massive heterogeneous 3D geospatial datasets and 3D mapping engines, making it possible to create interactive 3D apps for datasets like this one.