Bedrock.engineer Streams Subsurface Data at Nation Scale with 3D Tiles Voxels
The Netherlands, perhaps more than any other country, appreciates how critical what lies below the surface is to what's built above. Much of the country sits below sea level, meaning groundwater is high, and centuries of silt and sand deposits from continental rivers mean the soil is soft. Consequently, understanding the makeup of the ground is of paramount importance for city planning.
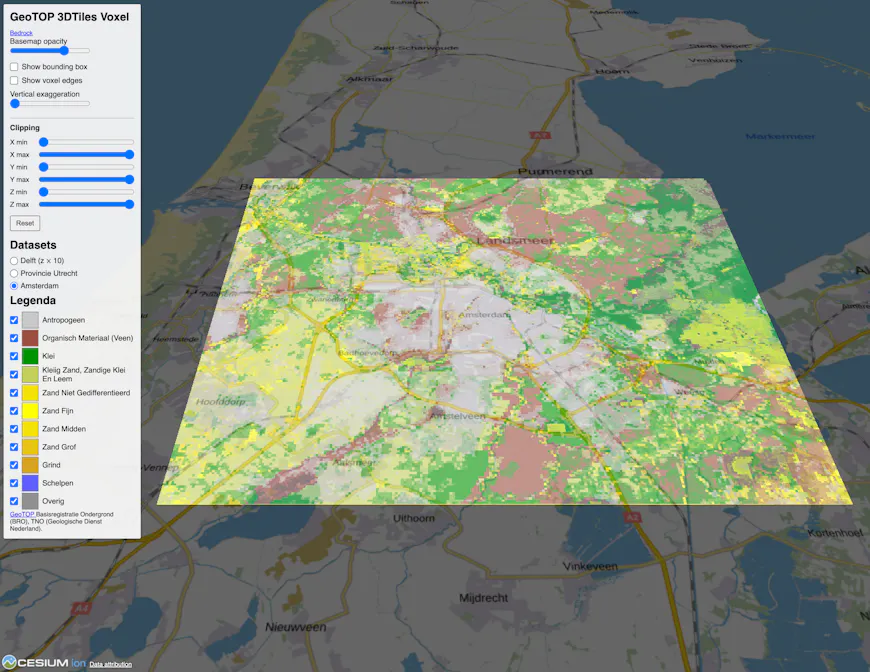
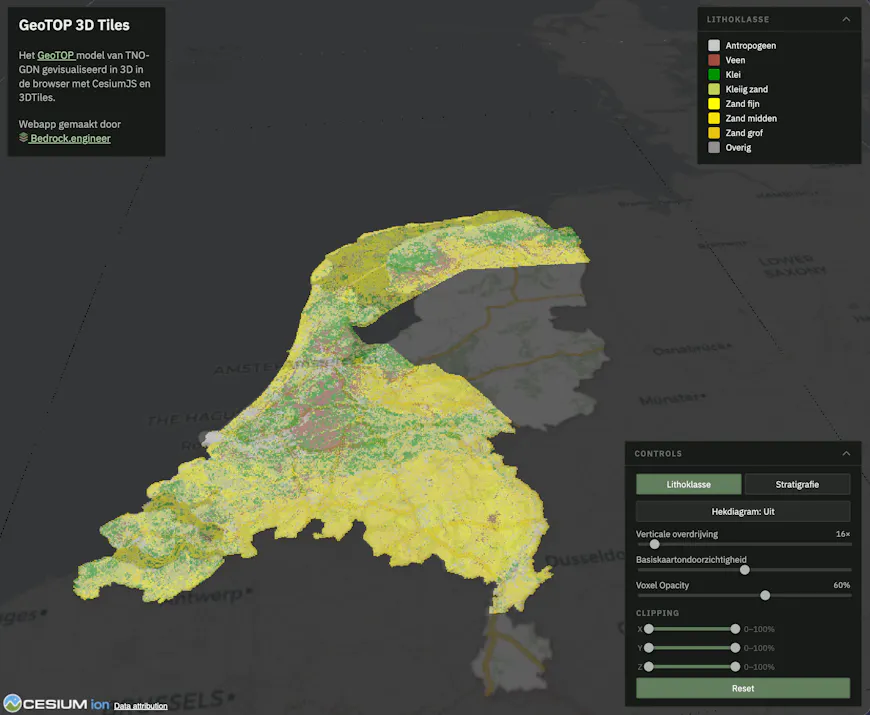
Bedrock.engineer visualizes large geospatial subsurface datasets using 3D Tiles voxels. Here they use 3D Tiles voxels to visualize GeoTOP, a public geological model of the Netherlands by the Dutch Geological Survey. Courtesy Bedrock.engineer.
Unfortunately, subsurface data is challenging to share: the science is highly technical, and visualizations are often limited to PDFs, hand‑drawn cross sections, or specialized desktop software. That’s why Bedrock.engineer was founded. Bedrock.engineer works to make geotechnical data—boreholes, CPT tests, ground models, and analysis results—more accessible and easier to integrate into the tools engineers and stakeholders use. One of their interests is 3D visualization of subsurface models in the browser. Using the 3D Tiles 2.0 draft voxels extension in CesiumJS, they are streaming large subsurface datasets, demonstrating how open-format 3D Tiles enables geological voxel models to be explored in spatial context directly in the browser. Open source software and open data formats are central to how Bedrock.engineer works.
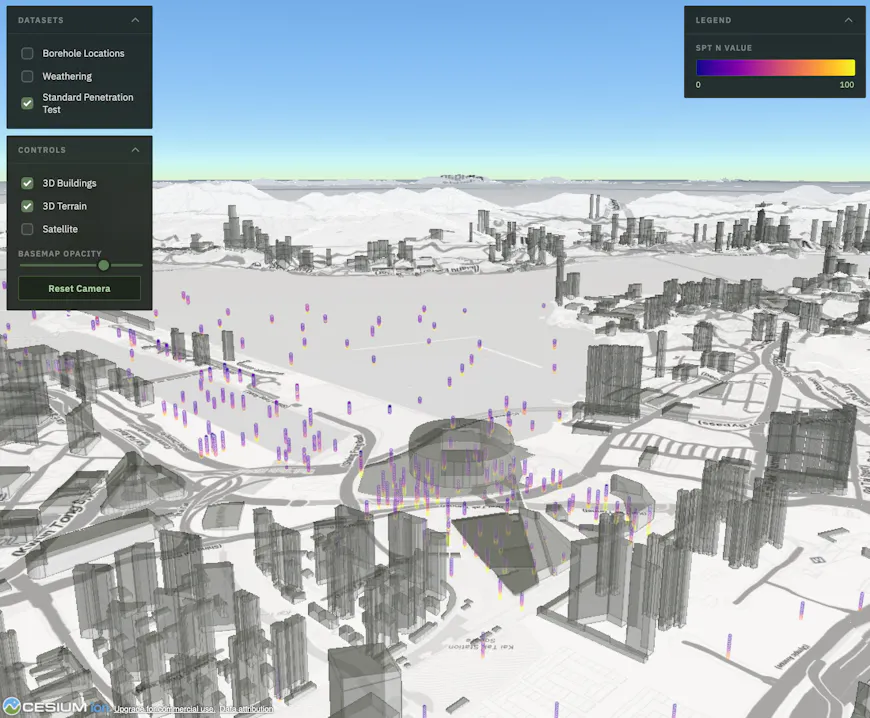
Bedrock.engineer visualizes subsurface data, like these boreholes in Hong Kong, together with above ground data in CesiumJS. Courtesy Bedrock.engineer.
Subsurface visualization with 3D Tiles voxels
Voxel representations, which can model continuous volumes and store material properties such as soil type, are ideal for subsurface datasets that hold continuous data like sediment layers. But visualizing very large voxel datasets in a geospatial context was not possible with open standards before 3D Tiles support.
Bedrock.engineer visualizes GeoTOP’s 50m deep subsurface data covering the entire Netherlands in CesiumJS using voxels. Courtesy Bedrock.engineer.
With the addition of voxel support in the draft 3D Tiles 2.0 specification, Bedrock.engineer can now combine voxel‑based subsurface models with 3D Tiles’ hierarchical streaming. Voxel renderings are currently a 3D Tiles extension and are part of the 3D Tiles 2.0 proposal, which was described at the 134th OGC Member Meeting in March. Bedrock.engineer has built their own Python tooling to convert gridded scientific formats, such as NetCDF, into 3D Tiles. 3D Tiles makes it possible to visualize dense, volumetric datasets covering an entire nation directly in the browser.
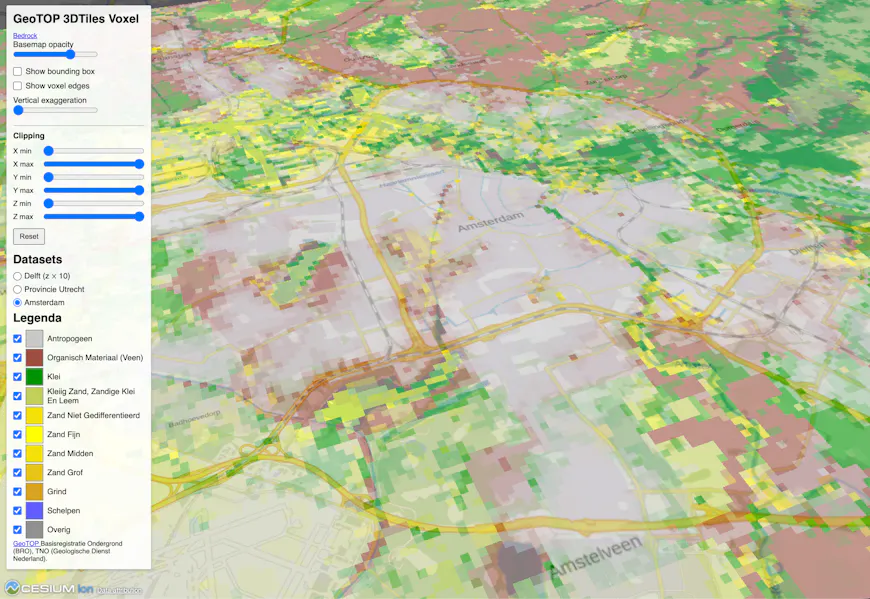
Bedrock.engineer brings GeoTOP data into CesiumJS using the 3D Tiles open standard, as in this dataset from Amsterdam. Courtesy Bedrock.engineer.
Geoscience data in CesiumJS
3D Tiles voxels make visualizing geoscience models possible, and bringing those 3D Tiles into CesiumJS makes it usable. What Bedrock.engineer appreciates most about CesiumJS is that visualizations are widely accessible to anyone with the link, allowing technical and nontechnical stakeholders to interact with the data directly.
"What 3D Tiles voxels change is accessibility. Subsurface models that used to require specialist desktop software can now be explored directly in the browser, in true 3D, in spatial context with the world above ground. And because it’s an open format, there’s no lock-in: anyone can build on it and combine it with their own data. That considerably lowers the barrier."
– Jules Blom, Cofounder Bedrock.engineer
By bringing subsurface data into CesiumJS, Bedrock.engineer is also able to combine that data with other datasets, including terrain and buildings, for a more complete picture. For city planning, seeing what is below ground is only valuable if it’s shown in context with the natural and built environment above. Building on CesiumJS, Bedrock.engineer has implemented multivariable filtering, allowing users to see just the relevant data for any given application.
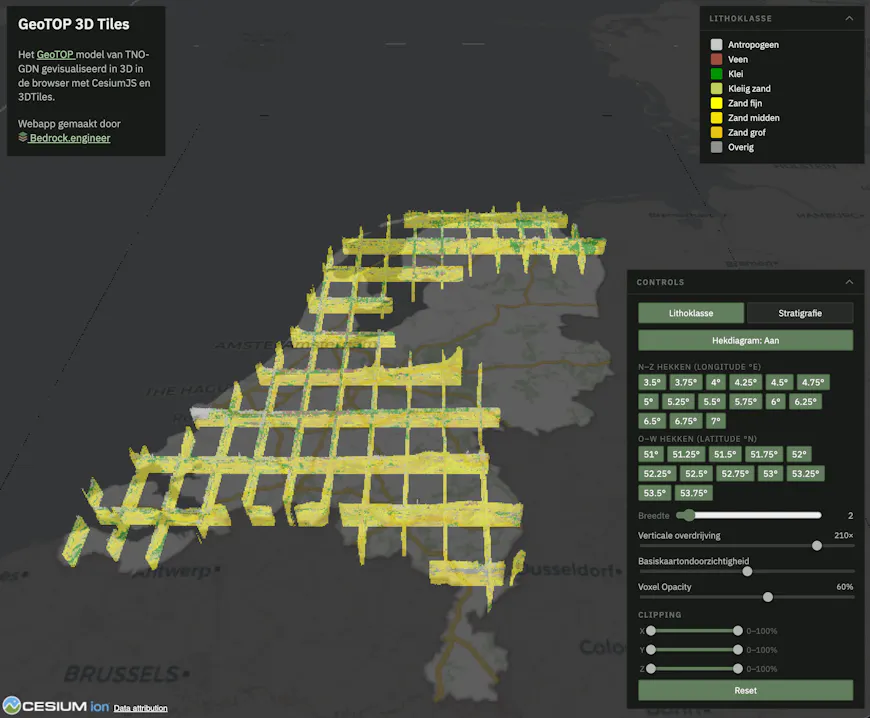
Fence diagrams make it easier to see layers of subsurface sediment. Courtesy Bedrock.engineer.
Public and commercial impact
A prime example of Bedrock.engineer’s work is their CesiumJS visualization of GeoTOP, a public geological model of the Netherlands by the Dutch Geological Survey. By bringing GeoTOP into CesiumJS as 3D Tiles, Bedrock.engineer can embed the model in any browser-based application, combine it with other datasets in spatial context, and build custom tools on top of it, all using an open standard.
Every square meter of land in the Netherlands is designated for a particular use, such as agricultural, urban development, or green space. Municipalities are legally obliged to consider subsurface data whenever it is relevant to a public task. Courtesy Bedrock.engineer.
The GeoTOP model is well suited for governments seeking to better understand the geological features of their area at a regional scale. In the Netherlands, government bodies are legally required to consult BRO subsurface data, including models like GeoTOP, whenever it is relevant to a public task. Bedrock.engineer’s visualization makes it easier to understand and communicate what that data actually shows. When a local government can clearly see what’s below ground, they can make better decisions around spatial planning, groundwater management, land subsidence, and dike safety assessments.
Such visualization can also be useful to building developers in the early stages of a project. Knowing whether they’ll be dealing with peat or sand makes a significant difference when considering foundation type. Though GeoTOP is not a substitute for a full geotechnical investigation, but it gives a useful first indication before that work begins.
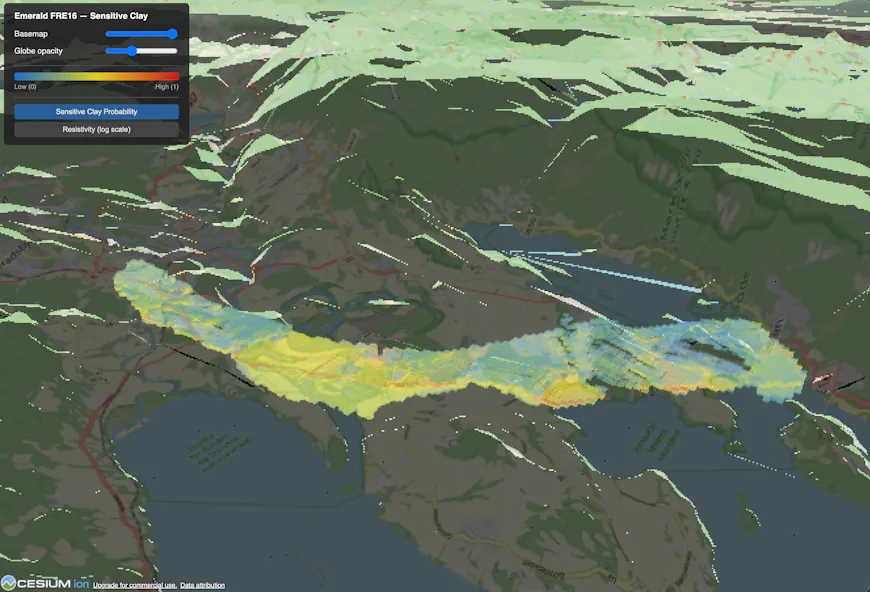
Semi-transparent voxel rendering of geophysical models reveals subsurface structures, creating an X-ray–like view of the underground. Data courtesy Emerald Geomodelling, image courtesy Bedrock.engineer.
Bedrock.engineer is working to add GeoTOP data to the LEIA viewer, a CesiumJS-based digital twin for the provincial government of Zeeland, Netherlands. Bringing GeoTOP into LEIA will allow policy makers to see subsurface data in spatial context with other government datasets. Bedrock.engineer has also brought a shallow subsurface model of the Antwerp urban region and harbor into CesiumJS, visualized as 3D Tiles voxels.
Voxel support is part of the draft 3D Tiles 2.0 specification, a key aspect of our commitment to open standards. If you’re working with volumetric data, explore the 3D Tiles OGC Community Standard, try it in CesiumJS, and share your feedback on GitHub. We’d love to see your implementation.