Community Experiments with Time-Dynamic 3D Tiles
This is a guest post by Pascal Poulain about some experimental work he did on embedding time series inside 3D Tiles. He uses weather prediction data to illustrate the concept. - Sarah
When visualizing spatio-temporal datasets in CesiumJS, out-of-core processing, based on 3D Tiles, can offer better capacities in terms of loading massive contents. This requires developers to first convert the input dataset into 3D Tiles according to a tiling strategy, and inside the CesiumJS application to natively optimize for massive loading with streaming and management of different levels of detail.
This post introduces some experimental work done to embed time series inside 3D Tiles. Doing so adds 4D capacity from temporal metadata stored in the tiles.
Weather prediction data
Numerical weather prediction can be accessed through a standardized data exchange format known as GRIB format. GRIB data are distributed in two formats by national or international weather agencies. The most usable for spatio-temporal needs is GRIB2.
As a basic overview, a GRIB file stores a set of messages. Each message
- is related to
undefinedundefinedundefinedundefinedundefined - and stores the value of that property at each point of the grid.
By analogy, if each message were an image,
- a grid point would be a pixel, and
- the value of the physical property would be the associated color.
Implementation
The general idea is to generate a time series of a physical property at each geolocalized point of the grid and to use the class sampledProperty to manipulate the time series within a tileset.
In the example below, the physical property is the expected fraction of clouds in a grid cell (cld_fract).
Conversion to 3D Tiles
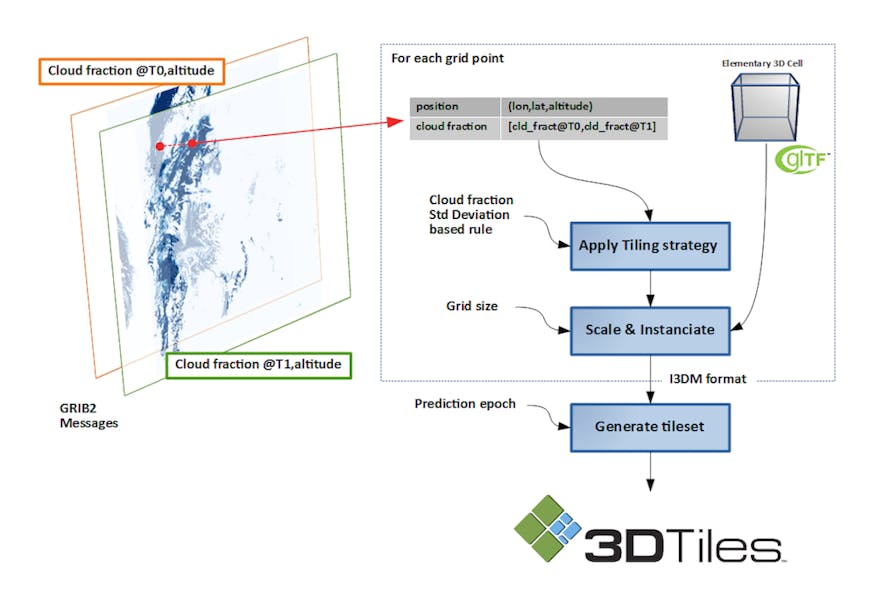
Principles of conversion.
Briefly, we
- Generate the time series of a physical property at each grid point.
- Compute the standard deviation of the physical property at each grid point to define a tiling rule to first display the cloudier areas.
- Pack the time series (as a single packed array compliant with sampledProperty), and store it into a String property in the batch table of a tile:
"_cld_fract":["0H,0.170000,3H,0.170000,6H,0.545000,9H,0.915000,12H,0.755000,15H,0.975000,18H,0.835000,21H,0.970000,24H,...","..."]
- Instanciate and scale an elementary cubic cell at each grid point by using instanced 3D Tiles (i3dm). With multi levels of altitude, it is an approximation but it makes it possible to cover the globe with only one glTF reference.
- Set an extra property, refTime, in the generated tileset (available with CesiumJS <=1.49) to store the prediction reference epoch.
"asset": {
    "version": "1.0",
    "tilesetVersion": "1.0.0"
  },
  "extras": {
    "refTime": "2018-10-14T00:00:00.00Z"
  },
  "root": {
    "children": [
      {
        "geometricError": 50541.20673151427,
        "refine": "ADD",
        "boundingVolume": {
          "region": [
            0.14333516482003592,
            0.7188574856651645,
            0.1782417498599205,
            0.7542004030180492,
            1808.2920847534178,
            5036.2290703125
          ]
        },
        "content": {
          "uri": ".\\5e15de58bb3c8665d8b2a70d4dc61997.json"
        }
      }
  }
Client application
When the tileset is loaded into a CesiumJS based application, some specific actions are defined to
- Unpack the time series to set a sampledProperty on each Cesium3DTileFeature from the loaded 3D Tiles. With sampledProperty, interpolation smoothly transitions between predictions.
- Apply a time-driven style using a styleExpression on the defined sampledProperty to drive how to render the 3D tileset.
- Trigger periodic refresh of the applied style based on the clock associated to the viewer.
Code
An example is better than a long description; below is a snippet of code to render a pseudo cloud cover from a 3D tileset generated with this methodology.
The expected fraction of clouds is used to set the alpha of the color assigned to a feature to simulate the cloud cover.
var viewer = new Cesium.Viewer('cesiumContainer');
var clock = viewer.clock;

var tileset = new Cesium.Cesium3DTileset({
    url: Cesium.buildModuleUrl('http://localhost:8080/3dtiles/weather/globe/tileset.json'),
      show: true,
      dynamicScreenSpaceError: true,
      shadows: Cesium.ShadowMode.DISABLED
});

tileset.readyPromise.then(readyFunction);

tileset.tileLoad.addEventListener(tileLoadFunction);

viewer.scene.primitives.add(tileset);

function readyFunction() {

      tileset.style = tileStyle;
      tileset.colorBlendMode = Cesium.Cesium3DTileColorBlendMode.REPLACE;
      var refTime;
      // Retreive prediction reference time.
      if (Cesium.defined(tileset.extras) && Cesium.defined(tileset.extras.refTime)) {
        refTime = Cesium.JulianDate.fromIso8601(tileset.extras.refTime);
      } else {
        refTime = Cesium.JulianDate.now();
      }
      // Define a periodic refresh of the associated style each min.
      tileset.refTime = refTime;
      tileset._lastMakeStyleDirtyUpdate = clock.currentTime;
      viewer.clock.onTick.addEventListener(function () {
        var currentTime =  clock.currentTime;
        if (Cesium.defined(this._lastMakeStyleDirtyUpdate) && !Cesium.JulianDate.equalsEpsilon(this._lastMakeStyleDirtyUpdate, currentTime,60)) {
          this.makeStyleDirty();
          this._lastMakeStyleDirtyUpdate =currentTime;
        }
      }, tileset);
    }

function tileLoadFunction (tile) {
      var content = tile.content;
      var featuresLength = content.featuresLength;
      // if the tile is already initialized, nothing is done.
      if (Cesium.defined(tile._isTimeSeriesInitialized) && tile._isTimeSeriesInitialized) {
        return;
      }
      //For each feature, the string form of the time series is tokenized and converted into a sampledProperty.
      for (var i = 0; i < featuresLength; i++) {
        var feature = content.getFeature(i);
        var timeSeries = {};
        if (Cesium.defined(feature.getProperty("_cld_fract"))) {
            var timeSerieProperty = new Cesium.SampledProperty(Number);
            timeSerieProperty.setInterpolationOptions({
              interpolationAlgorithm: Cesium.LinearApproximation
            });
            timeSerieProperty.backwardExtrapolationType = Cesium.ExtrapolationType.EXTRAPOLATE;
            timeSerieProperty.backwardExtrapolationDuration = 3600;
            timeSerieProperty.forwardExtrapolationType = Cesium.ExtrapolationType.EXTRAPOLATE;
            timeSerieProperty.forwardExtrapolationDuration = 7200;
            var packedValues = [];
            var packedValuesAsString = feature.getProperty("_cld_fract").split(",");
            for (var j= 0; j<packedValuesAsString.length;j++) {
                var value = packedValuesAsString[j];
                var val = (value.endsWith("H")) ? parseInt(value.slice(0, -1),10) * 3600 : parseFloat(value);
                packedValues.push(val);
            }
            timeSerieProperty.addSamplesPackedArray(packedValues, tile.tileset.refTime);
            timeSeries.cld_fract = timeSerieProperty;
        }
        content.getFeature(i).timeSeries = timeSeries;
        tile._isTimeSeriesInitialized = true;
      }

    }
 // example of style to animate the tiles.
 var tileStyle= new Cesium.Cesium3DTileStyle({
      show: {
        evaluate: function (feature) {
          var result = false;
          if (Cesium.defined(feature.timeSeries) && Cesium.defined(feature.timeSeries.cld_fract)) {
            var cld_fract = feature.timeSeries.cld_fract.getValue(clock.currentTime);
            result = (cld_fract > 0.20);
          }
          return result;
        }
      },
      color: {
        evaluateColor: function (feature, result) {
          if (Cesium.defined(feature.timeSeries) && Cesium.defined(feature.timeSeries.cld_fract)) {
            var cld_fract = feature.timeSeries.cld_fract.getValue(clock.currentTime);
            var alpha = (1 - Math.exp(-1 * cld_fract)) * 0.5;
            var displayColor = Cesium.Color.WHITESMOKE;
            result = displayColor.withAlpha(alpha);
          }
          return result;
        }
      }
Current limits
All the tiles are loaded based on the tileset definition without any check for time applicability. This is the applied style which controls the rendering over time by changing the transparency of the cells. This may generate performance issues on a large dataset. On the used data, some filtering has been applied at conversion level to not define instances for cells with a forecasted cloud cover below a threshold. By the end, the number of instances is below 200K to cover 80% the globe at 0.5° of resolution and one level of altitude.
Conclusion
The results from the experimentation are positive:
- It is possible to use 3D Tiles to support basic 4D use cases focused on temporal data that can be organized into time series.
- It provides some perspectives to add massive weather data in a CesiumJS application.
Below are some ideas of possible works to improve and generalize the methodology prior to use in production on massive datasets and spatio-temporal use cases:
- Load/unload 3D Tiles based on availability or applicability (start/end date).
- Use tile extensions to identify such kind of spatio-temporal 3D Tiles.
- Store sampledProperties in a more compact way in a batch table.
- Store timeInterval based data in a batch table.
- Do dynamic scaling of I3dm instanced feature.
- Improve rendering by setting a shader to “emulate” a cloud effect without performance drawbacks (weather case).
Acknowledgments
Thank you to
- METEO-FRANCE for sharing a GRIB2 dataset at a global and Western European level.
- European Centre for Medium-Range Weather Forecasts (ECMWF) for providing some API and tools to manipulate GRIB files: ecCodes
- PDAL team for proposing capacity to convert GRIB files: PDAL
- GDAL team for maintaining a driver for GRIB files: GDAL
- Cesium team for delivering a high quality API: CesiumJS