Dynamically Annotating 3D Tiles in CesiumJS
Visualizing and understanding massive 3D data often involves combining different formats into the same scene. 3D Tiles already enables this kind of data fusion. For greater flexibility, CesiumJS provides a classification system that allows you to dynamically highlight and annotate your 3D data using any arbitrary set of geometry.
For example, here we’ve got a detailed photogrammetry model of the entire city of Melbourne, Australia captured by AEROmetrex.

Photogrammetry model of the city of Melbourne, Australia, captured by AEROmetrex.
Perhaps you’re working on a proposal to improve road safety and you want to be able to see the different kinds of roads in the city. You can take this publicly available road dataset from the Australian government and add it to CesiumJS as a GeoJSON.
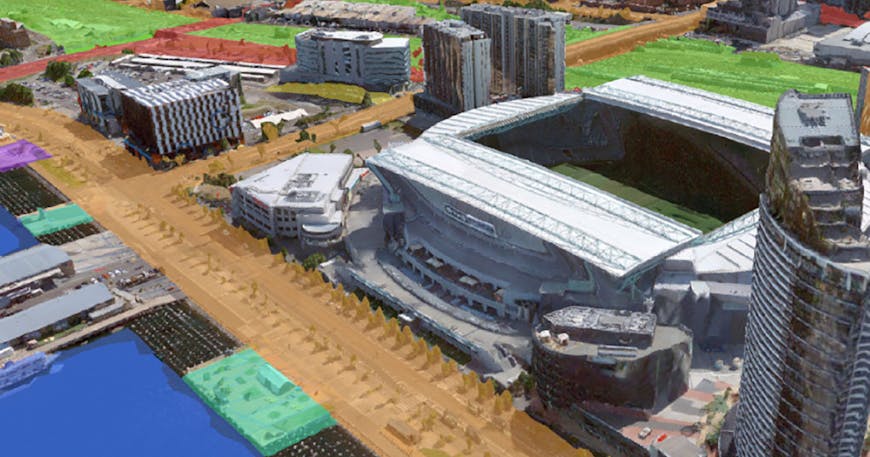
Photogrammetry model of Melbourne fused with a publicly available GeoJSON road dataset.
You can immediately see all public roads (orange), tram networks (green), and main arterial roads (red). You can even use CesiumJS’s mouse picking to get the street name on click. There’s no need to preprocess the tileset to include the road information, and the classified tileset could even be swapped out for a point cloud of the city.
Any arbitrary area or volume can be used to classify a tileset in CesiumJS. These classification volumes can be created dynamically in your application or loaded in from a data source. Even tilesets can be classification volumes for other tilesets. Here is a vector tileset highlighting interesting architectural structures in a point cloud model:
Dynamic highlighting of point clouds in CesiumJS. Point cloud by Dr. Peter Allen, Columbia University Robotics Lab. Scanning by Alejandro Troccoli and Matei Ciocarlie.
While 3D Tiles already has a rich styling language that allows you to selectively hide or highlight any features in your data, the classification system can be used independently of the dataset it’s applied to. This makes it especially useful when the semantic data applies to many tilesets, like the names of roads in a city.
How to use classification types
In a CesiumJS application, we start by loading our tileset from ion:
var tileset = viewer.scene.primitives.add(
    new Cesium.Cesium3DTileset({
        url: Cesium.IonResource.fromAssetId(...)
    })
);
We can then create a polygon entity and tell CesiumJS to use it for classification by setting itsclassificationTypeproperty:
var entity = viewer.entities.add({
    polygon : {
        hierarchy : new Cesium.PolygonHierarchy(Cesium.Cartesian3.fromRadiansArray([
          -1.3194369277314022, 0.6988062530900625,
          -1.3193955980204217, 0.6988091578771254,
          -1.3193931220959367, 0.698743632490865,
          -1.3194358224045408, 0.6987471965556998])),
        material : Cesium.Color.RED.withAlpha(0.5),
        classificationType : Cesium.ClassificationType.BOTH // Classifies both 3D Tiles and terrain.
    }
});
The intersection of this polygon and the tileset will be highlighted in red. Here we set it to Cesium.ClassificationType.BOTH to say it should highlight both terrain and 3D Tiles, but we could also set it to Cesium.ClassificationType.TERRAIN or Cesium.ClassificationType.CESIUM_3D_TILE to classify just one or the other. You can see a running example of this on Sandcastle.
A tileset can also be used to classify other tilesets by settings its classificationType in the same way:
var classificationTileset = viewer.scene.primitives.add(
    new Cesium.Cesium3DTileset({
        url: Cesium.IonResource.fromAssetId(...),
        classificationType: Cesium.ClassificationType.CESIUM_3D_TILE
    })
);
// Set the classification color to red.
classificationTileset.style = new Cesium.Cesium3DTileStyle({
    color: 'rgba(255, 0, 0, 0.5)'
});
The volume intersection of classificationTileset with any other tileset will now be highlighted.
Inverse classification
Instead of highlighting a volume, you might want to hide everything outside of a particular volume. This is useful for when you want to draw attention to a particular area without changing its color. This can be done by setting the invertClassification option to true on the scene:
// Turn on inverse classification
viewer.scene.invertClassification = true;
// Set the color that is multiplied by everything outside the classification volume
viewer.scene.invertClassificationColor = new Cesium.Color(0.25, 0.25, 0.25, 1.0);
You can then hide your classification tileset so you can see the original color of the underlying tileset:
classificationTileset.style = new Cesium.Cesium3DTileStyle({color : 'rgba(0,0,0,0)'});
We can apply this to the Melbourne dataset to see all the roads and dim the buildings.
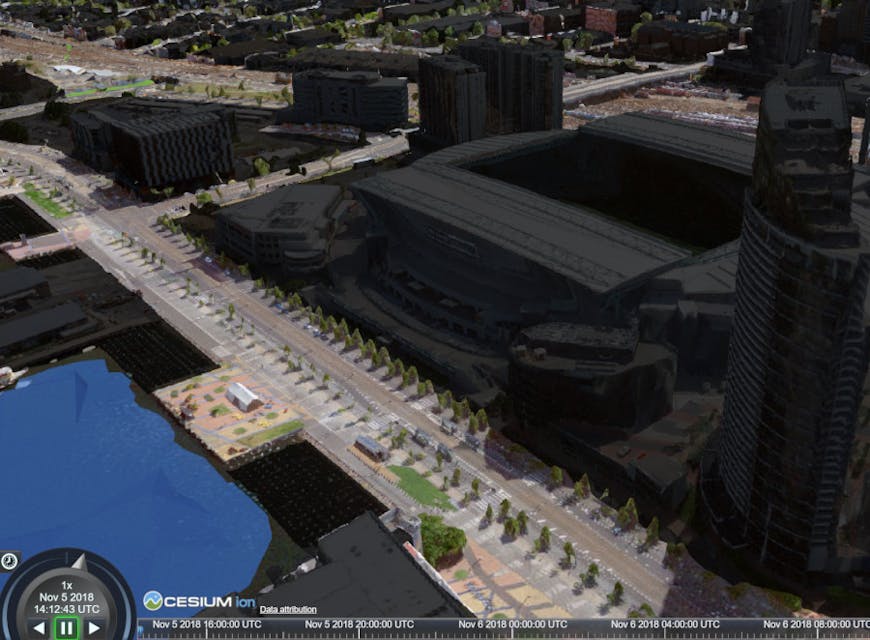
Using inverse classification to dim everything outside the specified volume.
We’re excited to see the applications these dynamic features make possible. Try it out by uploading your data to Cesium ion and visualizing in CesiumJS.