Visualize Oklahoma Tornado Totals and Wind Index from 1950 to 2017
Researchers Reuben Reyes and Dr. Lesya Borowska of the University of Oklahoma are using Cesium to visualize Oklahoma tornado counts by county from 1950 to 2017. The initial work started by taking tornado county totals from the National Weather Service and converting the data to KML and KMZ files. This dataset was imported into Cesium and put on the web for interactive viewing. The live demo is available to anyone with a web browser.
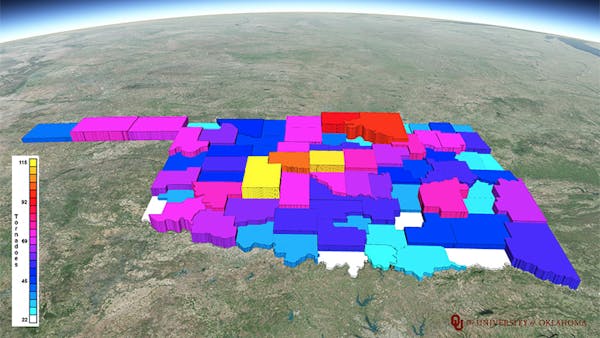
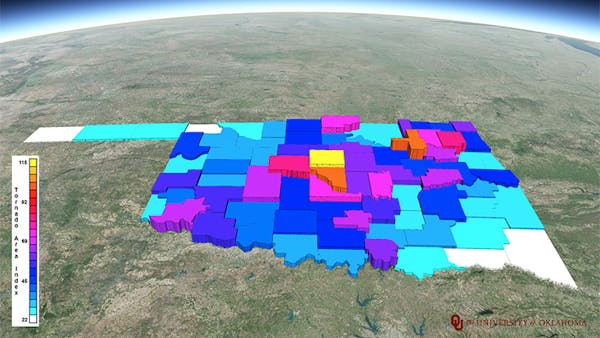
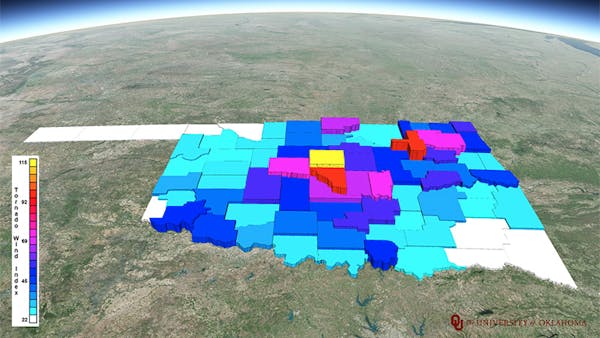
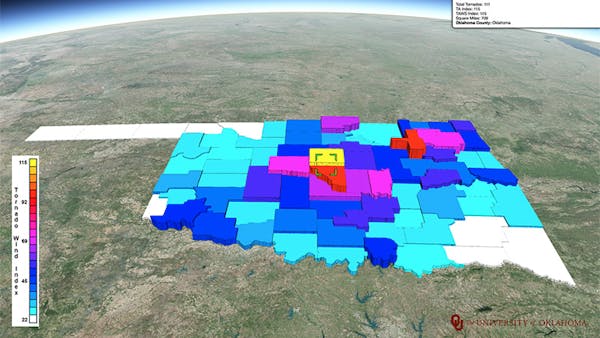
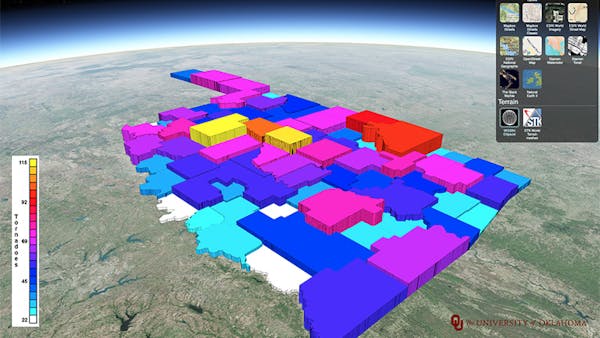
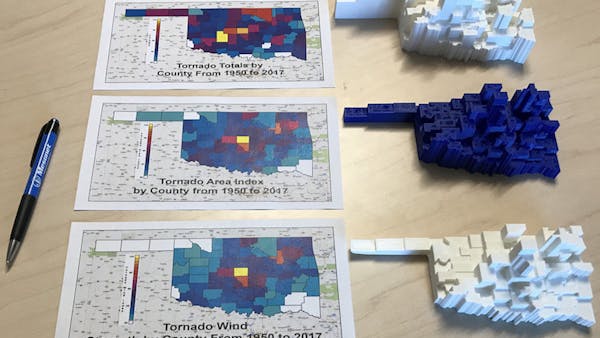
Oklahoma Tornado Totals by County Visualization represents three separate datasets dating from 1950 to 2017. The first dataset is tornado totals by county. The second dataset is an “Area Index” to better represent smaller and bigger counties by factoring in square miles. The third and last dataset takes into account wind speed to create a “Wind Index” that better represents the destructive power of each tornado. The benefit of using Cesium is that it allows for smooth representation and switching between the three datasets for viewing and interacting with geospatial temporal data. Part of this visualization includes a link to the KMZ files used in Cesium and STL files for 3D printing of the three datasets.