An Interactive Representation of Texas Groundwater Levels Over Time
Researchers Reuben Reyes and Jadwiga Ziolkowska of the University of Oklahoma are using Cesium for geospatial visualization. The initial work started using KML and KMZ files in Google Earth and NASA World Wind. Once KML file support became available in Cesium, a port was completed and put on the web using Cesium. This made a live demo available to anyone with a web browser.
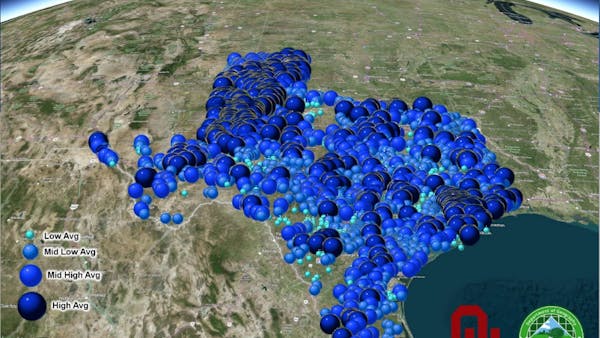
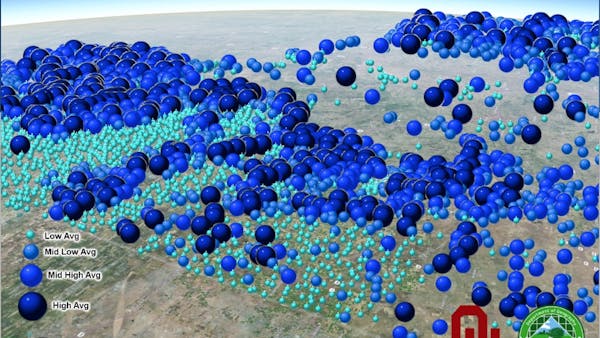
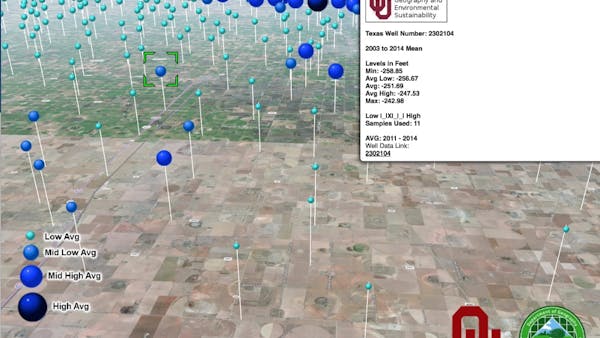
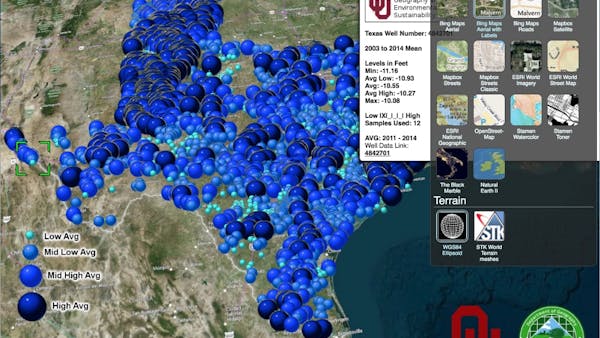
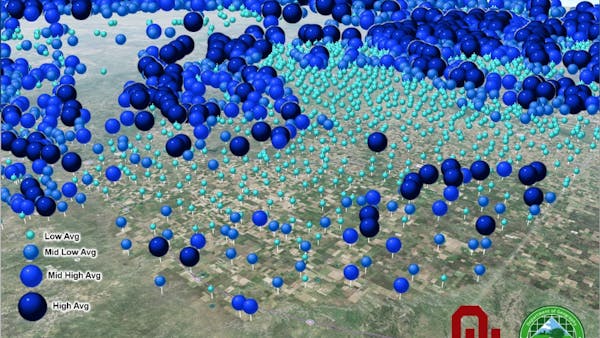
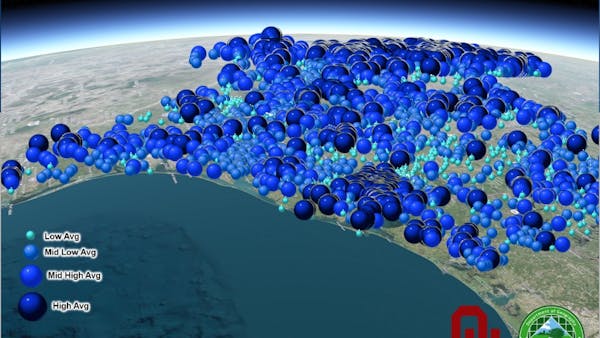
Texas Groundwater Well Levels Visualization represents groundwater levels during the 2003–2014 drought. This data was derived from 7,211 groundwater wells across Texas with approximately 140,000 data points. Each color in this visualization is based on normalized groundwater well levels. The benefit of using Cesium is that it allows for smooth representation of large data sets for viewing and interacting with geospatial scientific data.
A key part of the visualization is the above surface representation of underground water levels. This research and visualization resulted in a paper: Ziolkowska, J.R.; Reyes, R. (2016): Geological and Hydrological Visualization Models for Digital Earth Representation. Computers & Geosciences 94: 31–39.