OpenWebGIS: Calculate and Analyze Data for Free Online
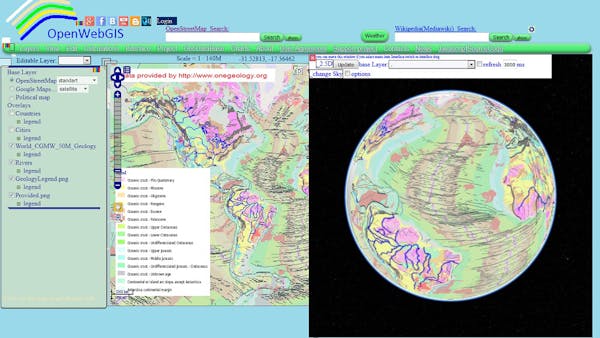
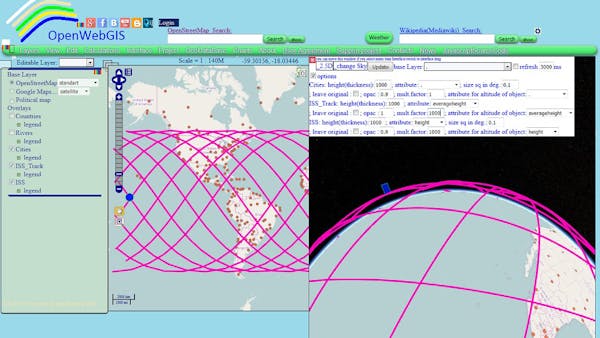
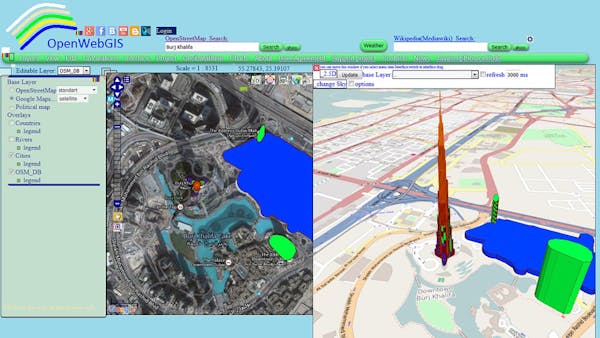
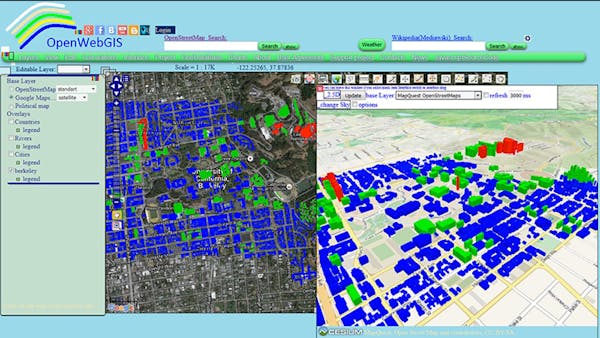
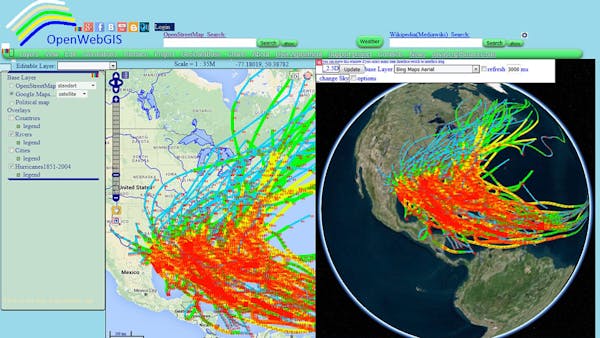
Initially OpenWebGIS was created only for use with a flat map. But soon it became clear that for a modern GIS with a scientific approach, a wide range of users cannot do without 3D visualization of their data. After considering existing 3D visualization software options, Fedor Kolomeyko, the developer of OpenWebGIS, chose Cesium because of its convenience, simplicity of usage, and effectiveness. What’s more, it does not require any plugins and settings from users. The basic principles of creating and using Cesium 3D view in OpenWebGIS were described in the article 3D maps, new version of Cesium JavaScript library and OpenWebGIS.
OpenWebGIS is constantly progressing and updating with additional features. Users can download the source code from the main menu and use it to create their projects. The goal of OpenWebGIS is the continuous improvement and spread of open source software, bringing the system steadily closer to the capabilities of desktop universal GIS systems.
OpenWebGIS has some additional features that distinguish it from many desktop and other online web GIS, for example, the module of the time series forecast, available in the menu item “Calculations-> Time and matrix analysis”. The system is focused on scientific analysis of spatial (and preferably not only spatial) data. The system is designed to have simple, understandable, and accessible functions, as well as including some entertaining elements to attract a wide range of users.
The OpenWebGIS blog and full list of articles about OpenWebGIS provide a lot of information about possibilities for users’ data with OpenWebGIS and Cesium. Check out the video on the 3D view in OpenWebGIS:
You can also see other videos at the OpenWebGIS YouTube channel.