耐震工学の研究者が歩むCesiumJS活用の軌跡 - デジタルツイン時代の構造ヘルスモニタリング
今回ご紹介するのは、大阪公立大学の金子健作博士による挑戦です。金子氏は建築物の耐震工学を専門とし、最近では、AIを活用した構造ヘルスモニタリング (SHM) を研究されています。SHMとは建物内に加速度センサを設置して、大きな地震の発生直後に建物の安全性を自動的に判定する技術です。このSHMの新たな展開に関して、金子博士はこのSHMシステムの普及を進めるために、3DのWeb GISで建物の安全性を可視化する新たなアプローチに挑戦しています。
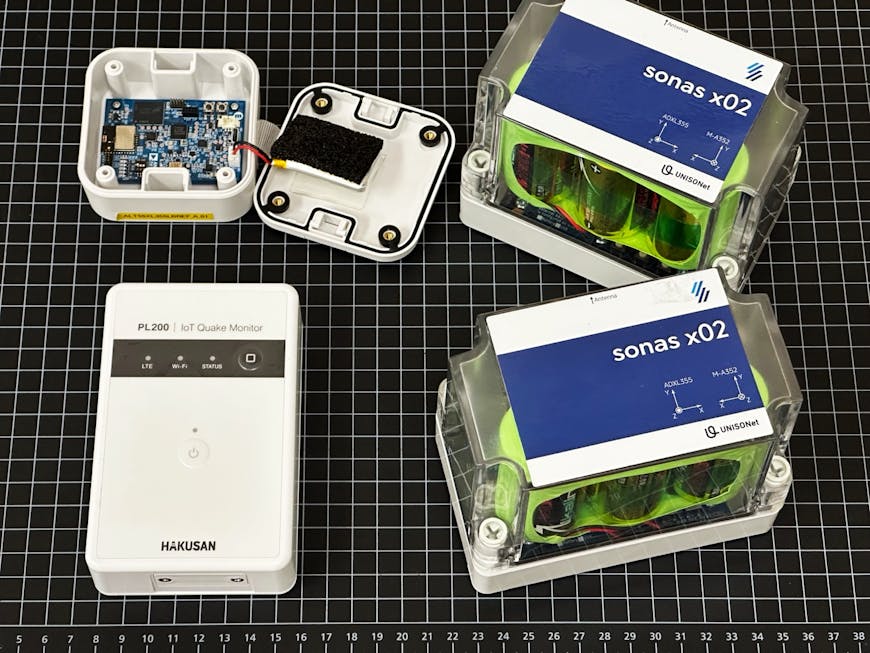
構造ヘルスモニタリング(SHM)に利用される加速度センサは、地震時の建物の揺れを記録します。これらのセンサは建物内に設置され、クラウドサーバーにデータを自動的にアップロードする機能もあります。(画像提供:金子 健作 博士)
1. Cesiumとの出会い
金子氏がCesiumJSに興味を持ったきっかけは、2021年に国土交通省のProject PLATEAUに関する記事を読んだことでした。Project PLATEAUは、日本全国の3D都市モデルを整備し、オープンデータとして公開する国家プロジェクトです。
「当時、私はGISを本格的に使ったことがありませんでした。しかし、PLATEAU ViewerでCesiumJSが使われていることを知り、試してみようと思いました。また、地球規模の数千kmから建物室内の数mまでスケール感を損なわずにシームレスに可視化できる点に強く惹かれました。」(金子博士)
最初は純粋な興味から始めましたが、CesiumJSの柔軟な3D可視化の可能性に魅了され、学びを深めていきました。2Dでは味わえない3Dならではのスケール感を実感し、オープンデータの活用とWebでの展開により、より多くの人々に役立つシステムを世に問うことが大きなモチベーションの一つとなりました。彼はCesiumJSで多数のエンティティを効率的にレンダリングし、地上構造物と地下構造物の両方を表示する方法を学ぶ中で、Cesium community forumなどのリソースを活用しました。
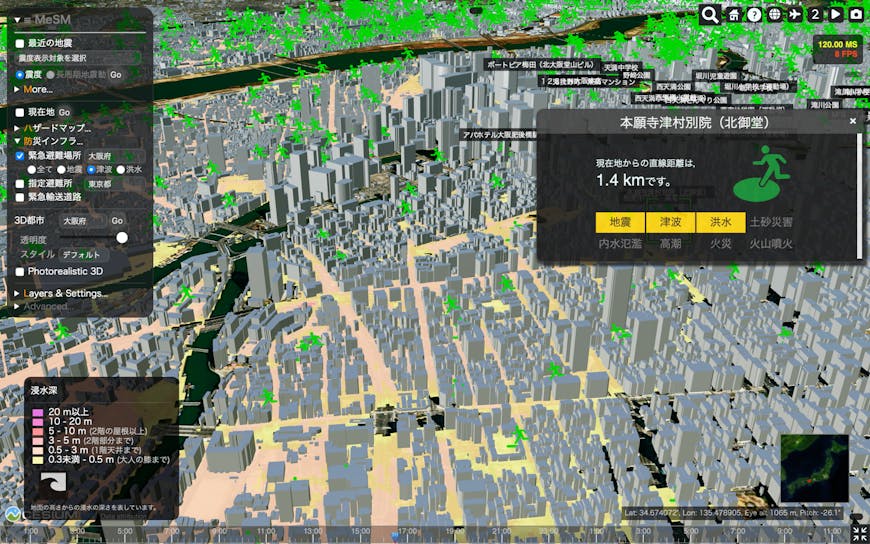
大阪市内で想定される津波浸水深と3D都市モデル、緊急避難場所の情報を重ね合わせてWeb上で表示した例。(画像提供:金子 健作 博士)
2. 研究への応用と実装
金子氏はAIによる都市スケールの広範囲な地震被害推定と構造ヘルスモニタリング(SHM) の統合を目指した先端的な研究に取り組んでおり、Cesiumはそれに役立てられています。将来的にSHMは、ドライブレコーダーのように多くの建物に導入されて一般市民に認知されことが期待されるなか、AIはSHMの普及を後押しすると金子氏は確信しています。研究過程で開発されたシステムは、「MeSM」と命名されています。MeSMという呼称は、Machine Learning-Enhanced Structural Health Monitoring(機械学習を活用した構造ヘルスモニタリング)プロジェクに由来しています。現在では、SHMの記録やAI機能を含む研究成果を省いた形で、市民が日常的に活用できるようにWebアプリケーションが一般公開され、防災講座や教育にも活用されています。
この研究プロジェクトは、三つのアプローチから構成されています。第一のアプローチは、日本の気象庁から得られる地震情報(震源位置、震源深さ、マグニチュードなど)を基に、3D都市モデルを活用して建物ごとの構造情報を考慮したうえで、事前学習したAIによって都市レベルでの地震被害を即時に推定するものです。この推定は、数十万棟規模あるいはそれ以上の面的な被害情報を含み、CesiumJSを用いて可視化されます。ただし、この手法には被害推定の不確かさが伴うという課題があります。第二のアプローチは、加速度センサを1台だけ設置した建物において、センサ情報と構造設計情報を組み合わせて被害推定を行うものです。この手法により、特定の建物に対しては高い確度での被害推定を可視化できます。現在は、集合住宅の設計・建設を主業務とする建設業者との共同研究を通じて、社会実装を展開している段階です。しかし、このアプローチは加速度センサ(SHMシステム)が導入されていない建物には適用できず、都市全体の面的な被害推定には利用できないという制約があります。第三のアプローチは、第一と第二のアプローチを統合したハイブリッド手法です。具体的には、SHMシステムが導入されている建物の情報を活用し、周辺の建物を含む面的に広がる建物群に対して、AIによる地震被害推定の信頼性を向上させるよう補正を行うものです。これは、カーナビゲーションシステムに例えると、GPSと車載センサを組み合わせて車の位置を推定する仕組みに類似しています。
第三のアプローチの実現には、SHMデータの共有(部分的なオープンデータ化)が不可欠ですが、その実現には制度的な課題や、利他的行為の必要性といった障壁などが多く存在します。そこで金子氏は、CesiumJSを用いた魅力的な可視化によって、この手法の必要性を段階的に社会へ示すことで、第三のアプローチの実現を目指しています。その取り組みの一環として、市民が日常的に活用できるWebアプリケーションが一般公開され、地震被害情報への理解や将来的な地震リスクへの関心を高めることが期待されています。
Cesiumを用いた最初の可視化実装には約2週間かかりましたが、その後はさらに湧き上がる興味が学習を後押ししました。Project PLATEAUの3D都市モデルのほかにも、気象庁や国土地理院、防災科学技術研究所、USGS(アメリカ地質調査所)などが公開する様々なオープンデータを活用して、CesiumJS上での3D可視化を実現しました。その後は少しずつ開発を進め、地震被害推定について開発したAIをOpen Neural Network Exchange(ONNX) ファイル形式でCesiumJSに統合するなど、数ヶ月程度で研究に活用できるレベルまで到達しました。
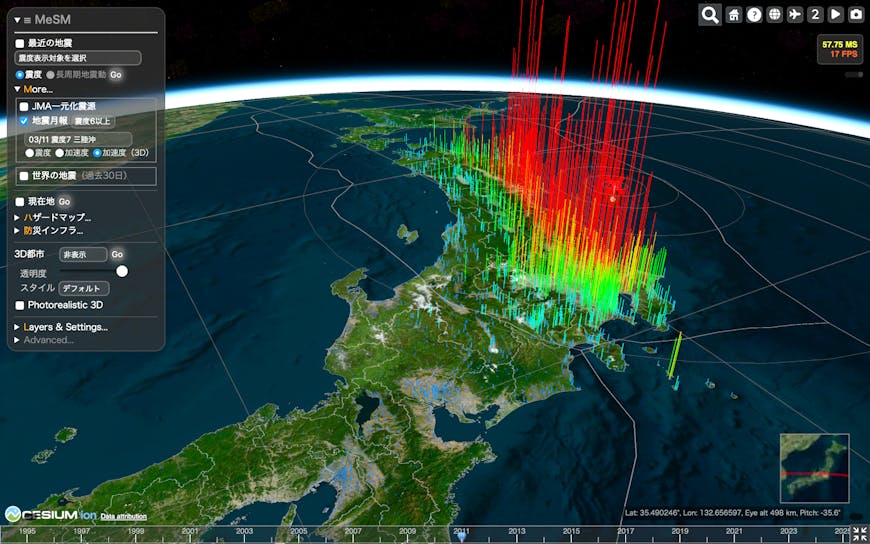
MeSM では、例えば2021年東北地方太平洋沖地震で観測された地表の加速度記録を3Dで対話的に閲覧することが可能です。(画像提供:金子 健作 博士)
さらに、MeSM では、人が体感できない小さな地震も含めて、震源の分布を3Dで表示し、回転アニメーションを通じて立体的に視覚化しています。(動画提供:金子 健作 博士)
3. Cesium Certifed Developerの取得と今後の研究の展望
金子氏がCesium Certifed Developer (CCD) の取得を考えたのは、Cesiumの知識修得の過程で恩恵を受けたオープンコミュニティーに恩返しをしたいという思いからでした。当初はJavaScriptもGISもまったくの初心者でしたが、1年でCCDを取得されるに至りました。
「Cesium Certified Developerには、地理空間情報やWebアプリケーション開発の専門家が応募するに値すると感じていました。最初は応募を躊躇しましたが、他分野からの積極的な参加がコミュニティーの発展に繋がると考えて、応募しました。」
金子氏は、継続的にCesiumJSを活用して研究を発展させるとともに、若い世代への教育や防災意識の向上にも貢献する考えです。彼が所属する大阪公立大学は、都市型の森之宮キャンパスを2025年に開設予定です。今後は、そのBIM(Building Information Modeling)などのデータをCesiumJSなどで活用し、都市から建物の室内までを結びつける新たな地震防災とSHMの挑戦に取り組んでいくようです。
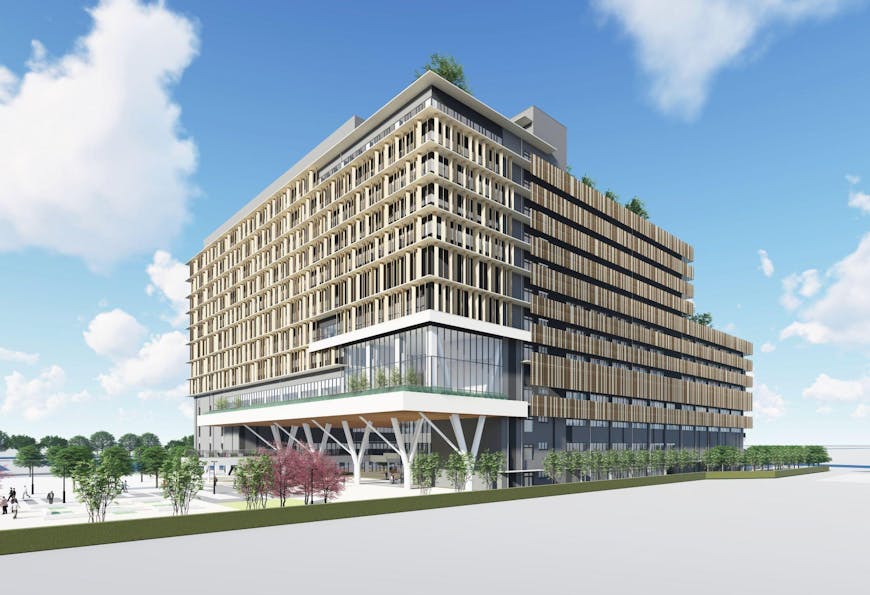
2025年秋に開学する大阪公立大学の都市型森之宮キャンパスのCG(画像提供: 大阪公立大学)
金子氏は、これからの展望について次のように語ります。
「3D地理情報の可視化は単なる技術ではなく、社会に貢献する手段です。見慣れたデータであっても、3D表示やさまざまなデータとの重ね合わせによって、新たな発見が生まれることがあります。その発見はユーザーごとに異なり、他者と共有することで、より多様な視点が生まれることが期待されます。」
CesiumJSを使用して、2Dでは見えなかった地理空間のインサイトを容易かつ効果的に視覚化し、分析する方法を学びましょう。
The Journey of an Earthquake Engineering Researcher Utilizing CesiumJS—Structural Health Monitoring in the Digital Twin Era
This article highlights the challenge taken on by Dr. Kensaku Kaneko from Osaka Metropolitan University. Specializing in earthquake engineering of buildings, Dr. Kaneko has recently been engaged in research on structural health monitoring (SHM) using AI. SHM involves installing accelerometers in buildings to automatically assess their structural safety immediately after a major earthquake. To promote the adoption of this SHM system, Dr. Kaneko is pioneering a new approach—visualizing building safety through 3D Web GIS.
Accelerometers used in SHM record the building's response during an earthquake. These sensors can automatically upload data to cloud servers. Courtesy Kensaku Kaneko.
1. Encountering Cesium
Dr. Kaneko’s interest in CesiumJS began in 2021 when he came across an article on Japan’s Project PLATEAU—a national initiative to develop and release 3D city models as open data.
“At the time, I had no prior experience with GIS. However, I learned that the PLATEAU Viewer used CesiumJS and decided to try it myself. I was deeply drawn to the ability to seamlessly visualize scales ranging from thousands of kilometers down to just a few meters inside a building without losing a sense of scale,” recalls Dr. Kaneko.
What began as a simple curiosity turned into a deep interest, as he became captivated by CesiumJS’s flexibility for 3D visualization. Experiencing a sense of scale not achievable in 2D and realizing the potential to create open, web-based systems that could benefit society became a strong motivation. As he learned to efficiently render large numbers of entities and display both above-ground and underground structures in CesiumJS, Dr. Kaneko used resources like the Cesium community forum.
An example of a web-based visualization combining projected tsunami inundation depths in Osaka, 3D city models, and emergency evacuation sites. Courtesy Kensaku Kaneko.
2. Application to research and implementation
Dr. Kaneko is conducting advanced research that integrates AI-driven large-scale earthquake damage estimation with SHM. CesiumJS plays a vital role in this endeavor. He envisions SHM becoming as commonplace and familiar to the public as dashboard cameras in the future. AI, he believes, will play a key role in accelerating SHM’s widespread adoption.
Through this research, Dr. Kaneko developed MeSM, short for Machine Learning-Enhanced Structural Health Monitoring. A simplified version of the system—excluding the SHM logs and AI functionality—is publicly available. This web app is already being used in disaster preparedness courses and educational programs.
The research project is built on three core approaches:
- Using earthquake data (e.g., epicenter location, depth, magnitude) from the Japan Meteorological Agency and integrating pre-trained AI models with 3D city models to estimate urban-scale earthquake damage in real time. This allows visualization of damage across hundreds of thousands of buildings using CesiumJS. This method involves a degree of uncertainty in its predictions.
- By installing a single accelerometer in a building and combining its data with structural design information, it enables more accurate damage estimation for individual buildings. This approach is currently being applied through joint research with a construction firm specializing in residential buildings. This is not suitable for buildings without SHM sensors and thus does not support area-wide damage assessments.
- A hybrid method combines the above two approaches. Information from SHM-equipped buildings is used to correct and enhance the AI-driven estimates for surrounding buildings. This is similar to how GPS and vehicle sensors are used together to improve location accuracy in car navigation systems.
To implement this third approach, sharing SHM data (even partially as open data) is essential. However, institutional barriers and the need for altruistic participation pose challenges. Dr. Kaneko aims to overcome these through compelling visualizations using CesiumJS, raising awareness of the method’s societal value via the existing public version of MeSM, encouraging public engagement with earthquake risk.
The initial Cesium visualization took about two weeks to build, but Dr. Kaneko’s curiosity drove him to further deepen his skills. In addition to Project PLATEAU’s 3D city models, he leveraged open data from the Japan Meteorological Agency, Geospatial Information Authority of Japan (GSI), National Research Institute for Earth Science and Disaster Resilience (NIED), and the US Geological Survey (USGS).
Within a few months, he advanced the system to a research-ready level, even integrating his AI model into CesiumJS using the Open Neural Network Exchange (ONNX) format.
In MeSM, users can interactively explore surface acceleration data recorded during the 2011 Great East Japan Earthquake in 3D. Courtesy Kensaku Kaneko.
MeSM visualizes earthquake epicenter distributions in 3D—even for small, imperceptible quakes—enhanced with rotating animations to provide a spatially intuitive experience. Courtesy Kensaku Kaneko.
3. Becoming a Cesium Certified Developer and future prospects
Dr. Kaneko pursued the Cesium Certified Developer (CCD) certification with a desire to give back to the open community that had supported his learning journey. Despite having no prior experience with JavaScript or GIS, he became a CCD within a year.
“I felt the CCD program was something best suited for experts in geospatial and web application development. I was hesitant at first, but I came to believe that active participation from those in other fields would benefit the community,” he says.
The university he belongs to, Osaka Metropolitan University, is scheduled to open its urban Morinomiya Campus in 2025. Looking ahead, Dr. Kaneko aims to continue using CesiumJS in his research while also contributing to public disaster awareness and education for younger generations.
A CG rendering of the urban Morinomiya campus of Osaka Metropolitan University, scheduled to open in fall 2025. Courtesy of Osaka Metropolitan University.
He is now exploring the use of BIM (Building Information Modeling) to build an integrated disaster response and SHM platform that connects entire cities to the interiors of individual buildings.
“3D geospatial visualization is more than just a technical capability—it’s a tool for social contribution. Even familiar data can lead to new discoveries when visualized in 3D or combined with other datasets. These insights vary by user and can multiply through sharing and collaboration,” he notes.
Learn how to visualize and analyze geospatial insights—beyond what’s possible in 2D—effectively using CesiumJS.