How Close do Iridium Satellites Need to Be to Get 5 Bars?
This is a guest post by Michael Krumpus of nootropic design, an IoT and electronics company, about his recent project using CesiumJS to visualize Iridium satellite positions vs. signal strength.
I recently wanted to help a client understand how reliable a satellite data uplink to Iridium satellites would be.
When communicating with a constellation of satellites like Iridium—which provides coverage to satellite phones and other devices in remote areas—sometimes you need to wait until a satellite is overhead before you get a reliable data transmission.
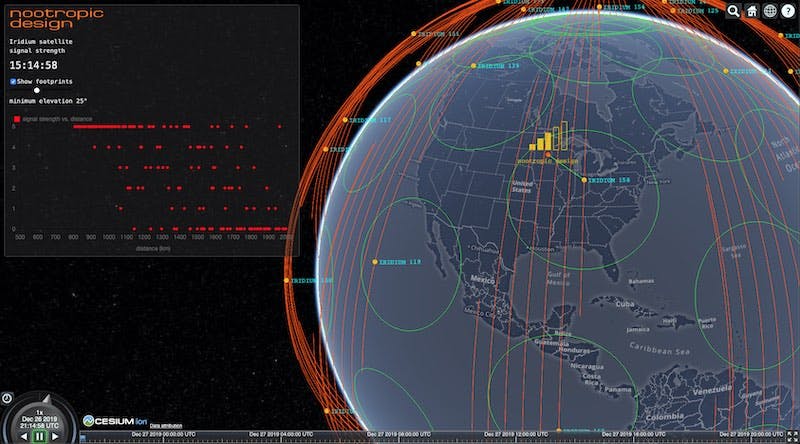
Comparing signal strength to real-time satellite position. The scatter plot shows the signal strength vs. the distance to the closest satellite: higher signal readings are correlated with shorter distances to the closest satellite.
The satellite modem hardware used for communication reports a signal strength in 0-5 “bars,” just like your mobile phone. So I set up an experiment: I deployed a simple development board that asks the modem for the “signal strength” every 5 seconds and publishes it to an MQTT topic. I also wrote a web tool using CesiumJS that displays the orbits of all the Iridium satellites. When you bring it all together, you can see the location of the Iridium satellites in orbit, your position on the globe, and your signal strength.
For more details on how I put it together, check out the full project writeup and the source code.
The live visualization shows current satellite positions, but because these satellites move relatively slowly around the earth, the changes in signal strength over a short time aren’t very dramatic. One of the great features of CesiumJS is the ability to create a time-series data model so that a visualization can be “rewound” to the past and played back at a different speed. By replaying the information back at higher speed, the correlation between satellite proximity and signal strength became crystal clear.
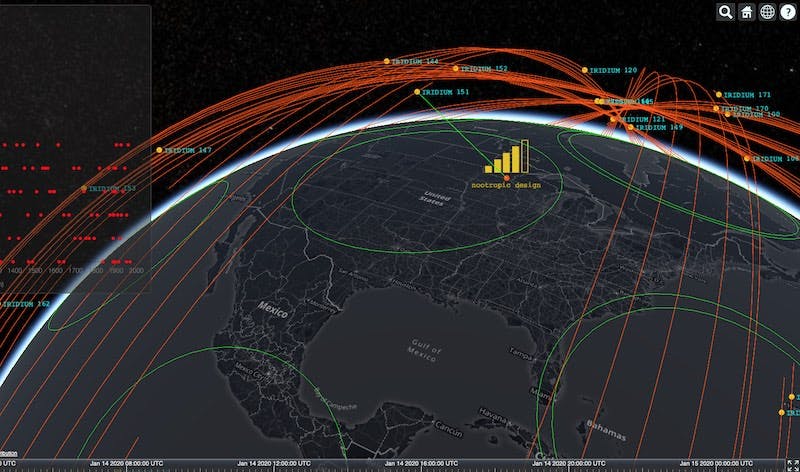
As the visualization makes clear, closer proximity to a satellite provides a stronger and more reliable signal.
This kind of visualization is only possible with a time dynamic 3D globe, like Cesium’s. And bringing the satellite orbits, receiver position, and signal strength all together in a single visualization made the reliability of the system much easier to grasp.
Understanding how communication reliability is related to satellite positions will only become more important as companies like SpaceX deploy large constellations of satellites.