An Interactive Representation of Geothermal Heat Index Curves Below the Texas Surface
Researchers Reuben Reyes and Jadwiga Ziolkowska of the University of Oklahoma are using Cesium for geospatial and subsurface visualization. The initial work started using KML and KMZ files in Google Earth and NASA World Wind. Once KML file support became available in Cesium, a port was completed and put on the web using CesiumJS. This made a live demo available to anyone with a web browser.
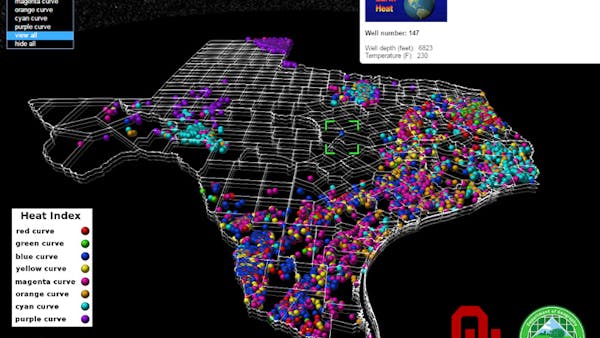
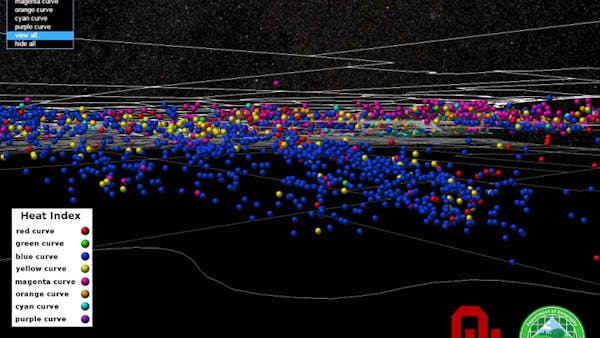
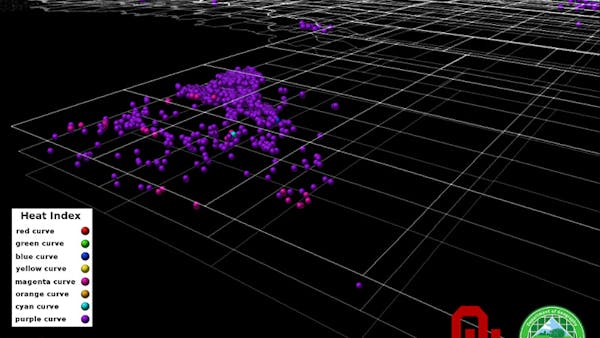
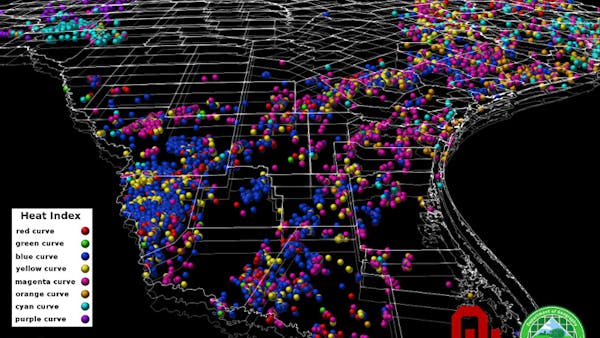
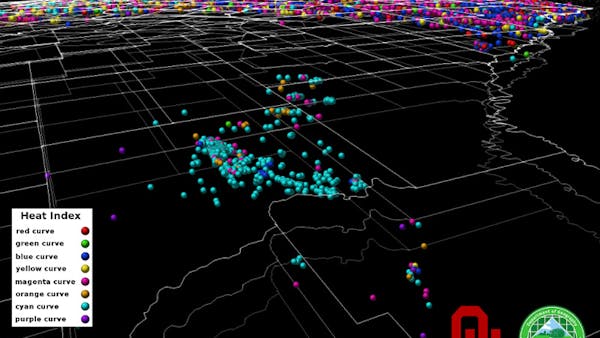
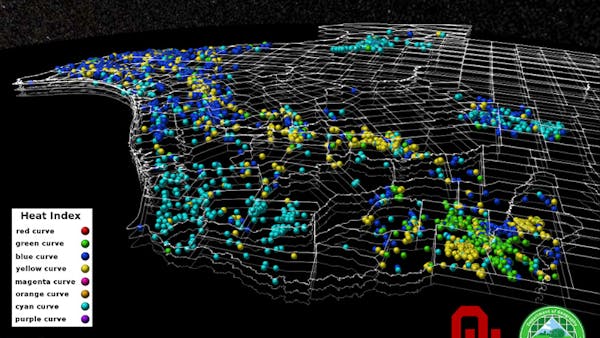
Texas Geothermal Subsurface Visualization represents heat indexes below the Earth’s surface. This data was derived from approximately 30,000 wells across Texas. Each color is based on a temperature curve. The benefit of using Cesium is that it allows for smooth subsurface viewing and interacting with geospatial scientific data sets.
A key part of the visualization is the subsurface representation below ground to negative 20,000 feet. To create a clearer display of the subsurface representation, vector outlines of Texas counties at different depths act as a wire frame underground. Each wire frame representation was depth shaded to give visual clues at different depths. This research and visualization resulted in a paper: Ziolkowska, J.R.; Reyes, R. (2016): Geological and Hydrological Visualization Models for Digital Earth Representation. Computers & Geosciences 94: 31–39.