 |
Cesium for Unreal 2.26.0
|
 |
Cesium for Unreal 2.26.0
|
This guide will help you find performance problems in your C++ code using Unreal Insights, included with Unreal Engine.
Unreal Insights can display the scope of timing events as well as activity across threads. There is minimal impact to app execution, and you can set up your own custom events. It provides more functionality than an exclusive CPU sampling-based profiler, although both tools can complement each other.
In this example, we will use our Cesium performance tests. Follow the steps outlined here.
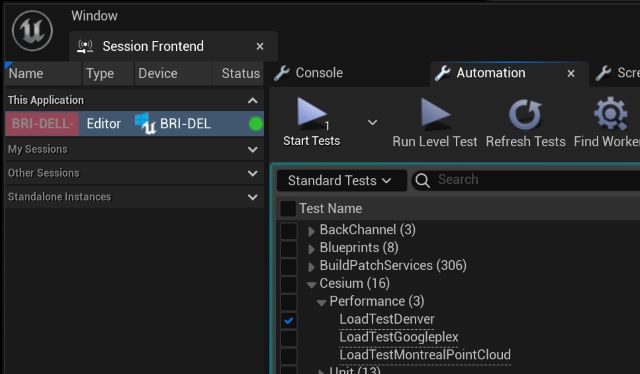
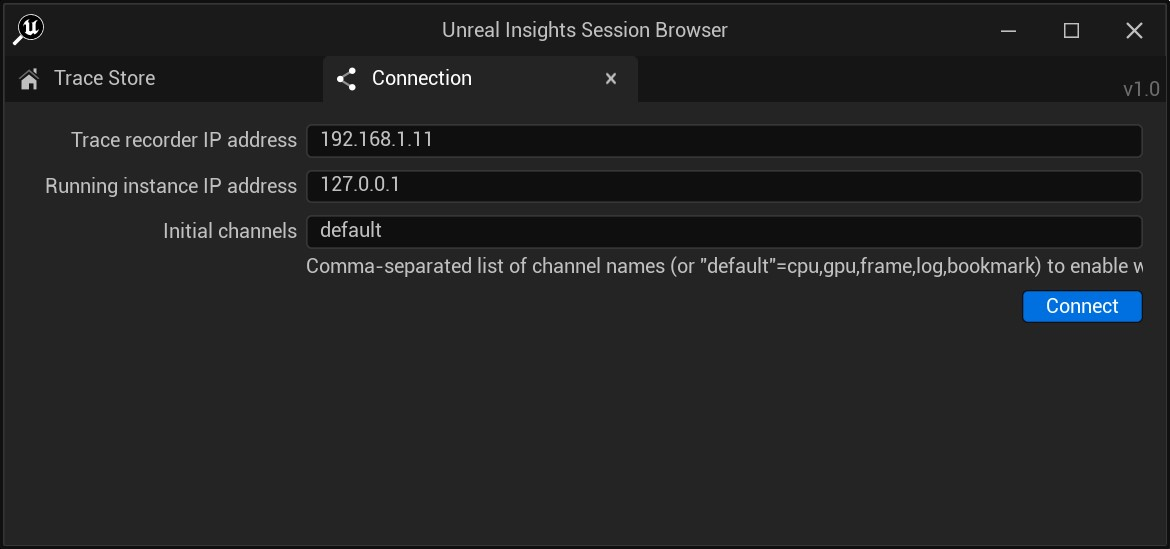
You can also find UnrealInsights.exe in
UE_5.X/Engine/Binaries/Win64
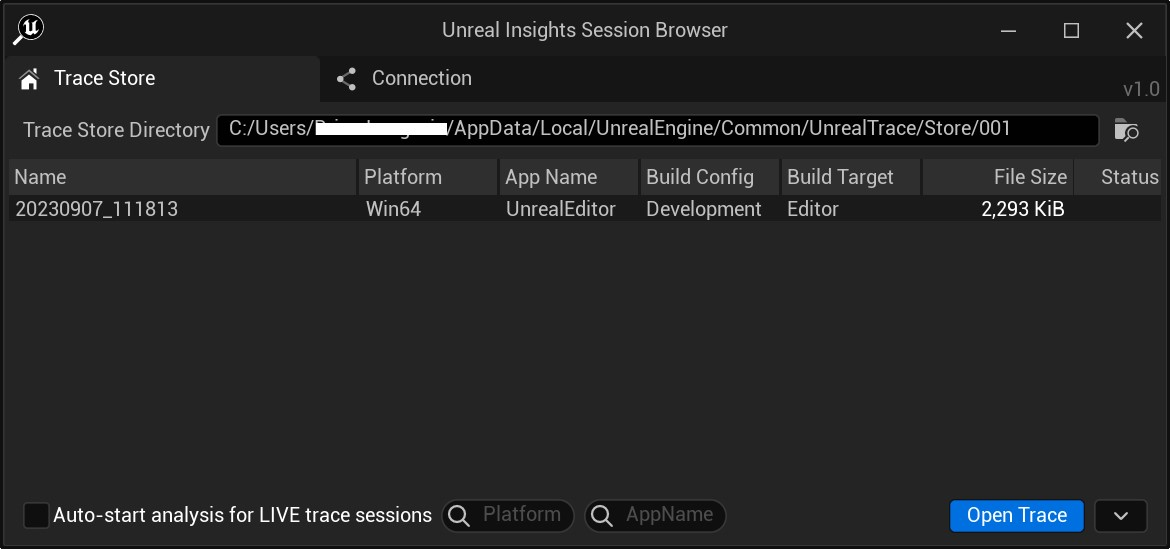
On the right side, there's a "Explore Trace Store Directory" button. You can click on this to delete or organize your traces
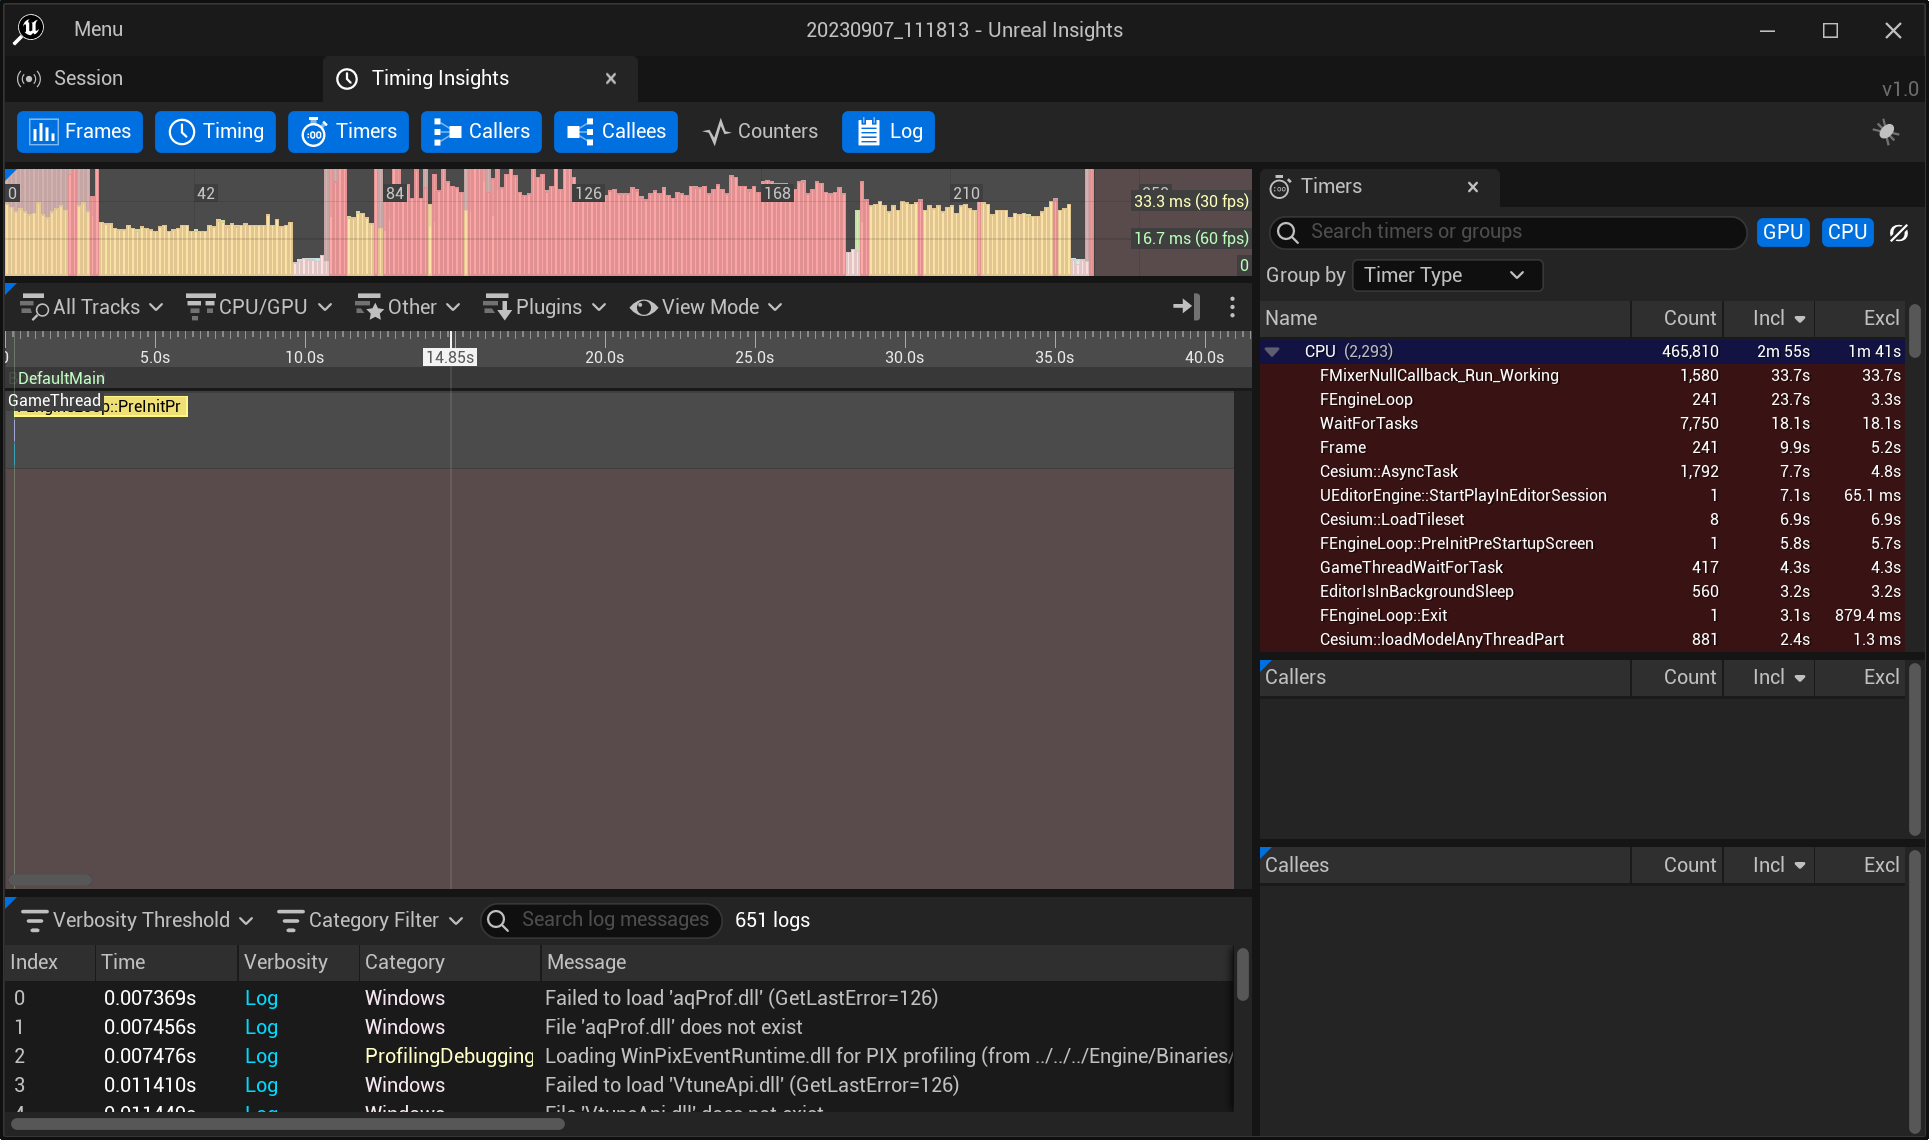
By default, the Timings Insights Tab is shown. More detail can be found here.
For this session, there are several sections of interest for us:

RenderThread 3-7, BackgroundThreadPool #1, ForegroundWorker #0-#1, DDC IO ThreadPool #0-#2, Reserve Worker #0-#13, AudioMixerXXXThe view should be a lot cleaner now 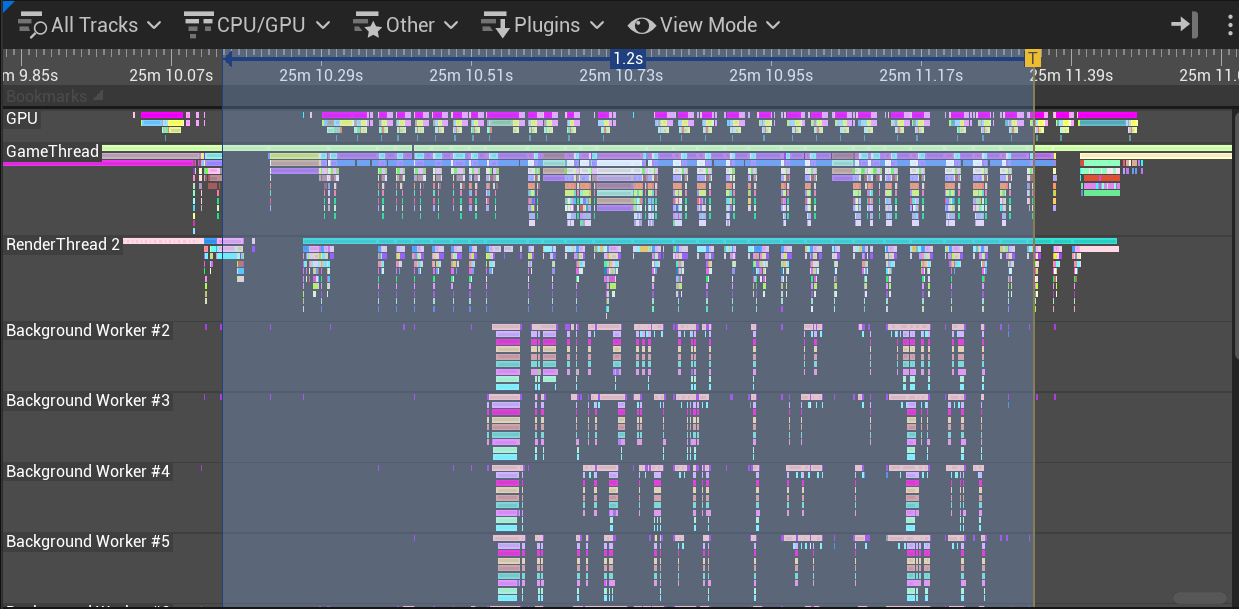
Let's look at the Timers tab.
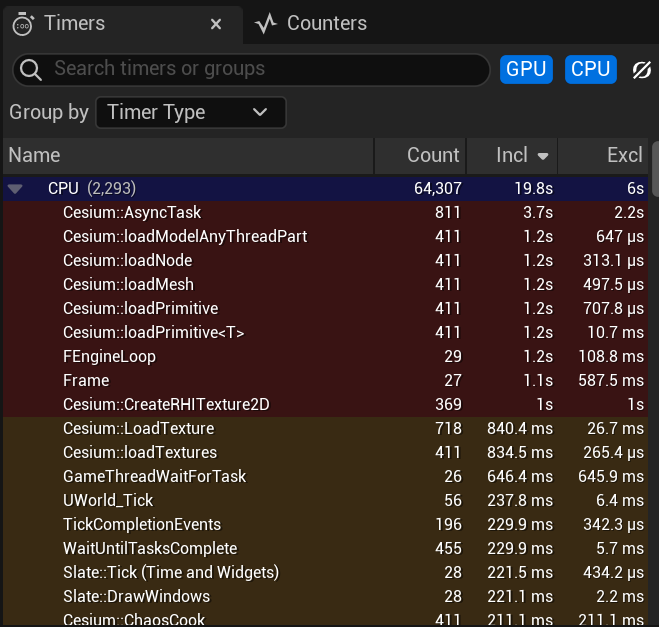
Every row is a timing event. Some events come from the engine, some are custom timers in the Cesium for Unreal plugin code. You'll notice that Incl is sorting descending, showing the events with the highest inclusive time.
You may feel the need to jump right in to
Cesium::CreateRHITexture2D. It seems to have one of the highest exclusive times (Excl) of any of the events in the list, 1 second. After all, our selection is only 1.2 seconds long, so this must be the performance bottleneck right? Hold on. The total sampled time at the top (CPU) is 19.8s, indicating the times are the total sampled times across threads, not absolute session duration.
Given that the sampled time of the highest cost calls are actually somewhat small compared to the total sampled CPU time, our bottleneck is most likely outside of our timed events.
This brings us to...
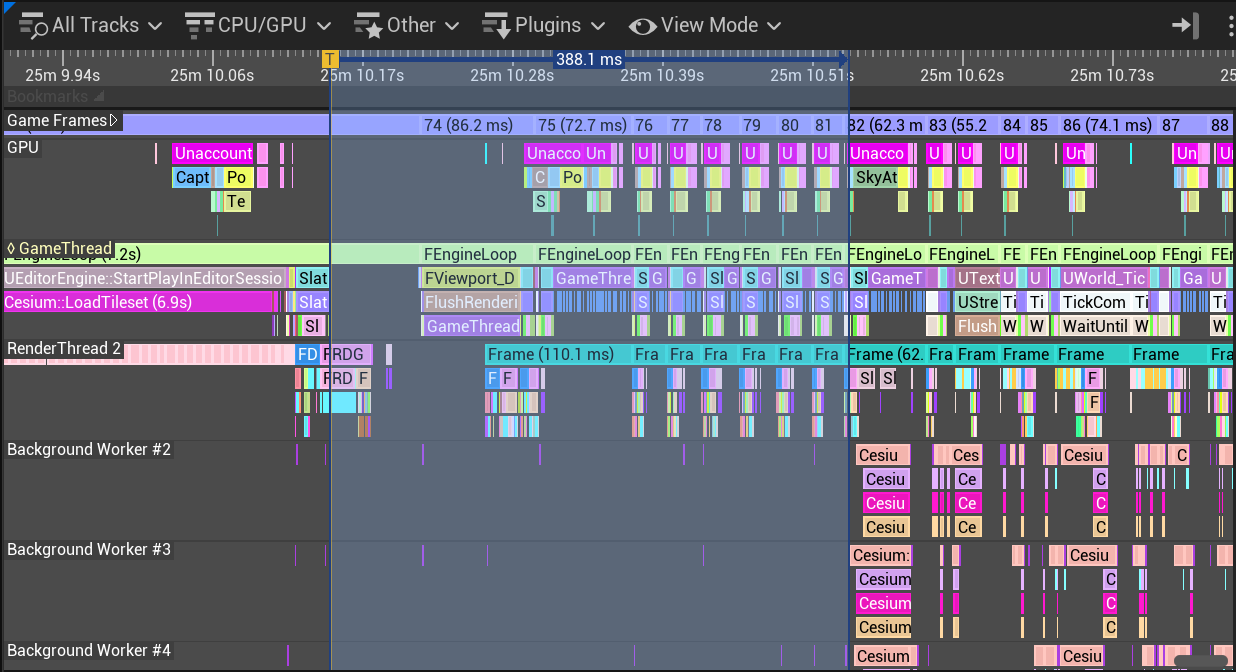
The selected area is the first phase of the loading test. This is a region between when the start mark was logged until when background workers start loading models.
It lasts about 8 game frames, or 388 ms, and does not seem to be making use of background threads at all. Could be something to investigate.
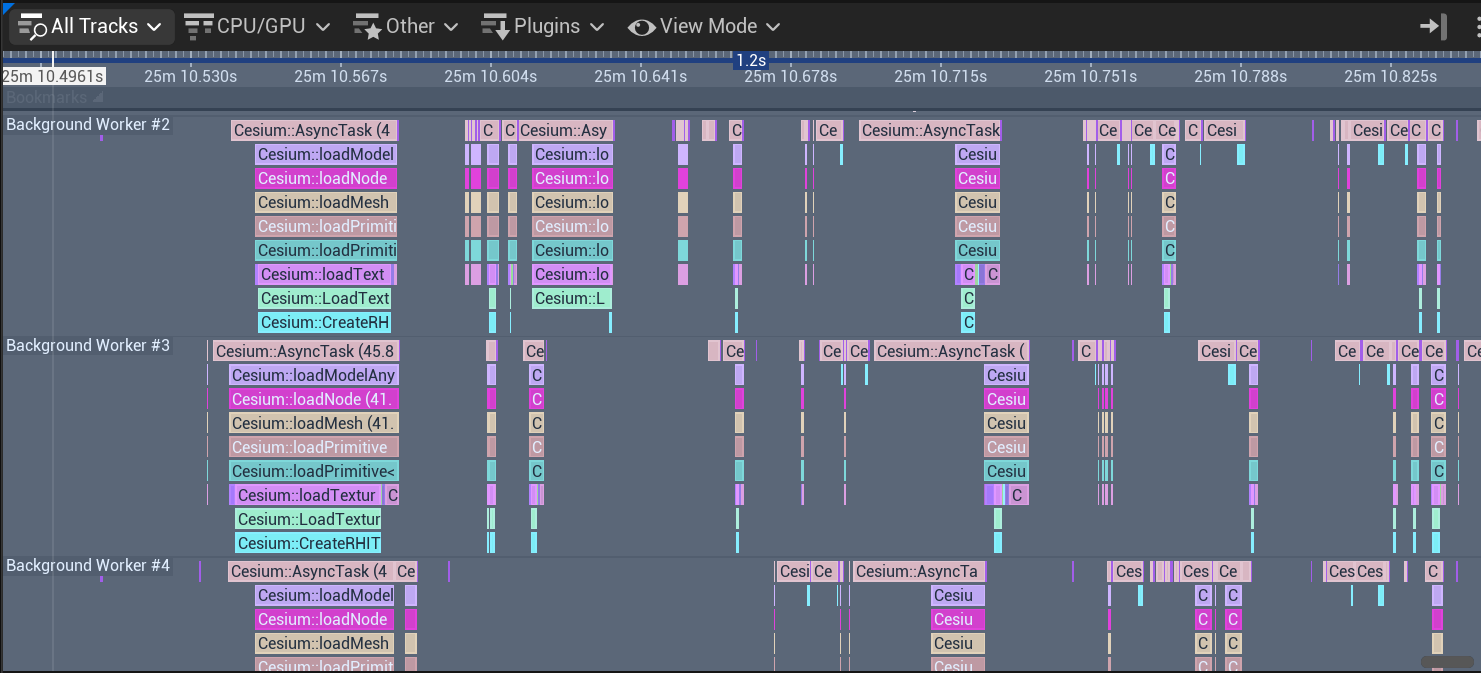
This selected area is zoomed in enough to see that the background workers are all calling the same functions. They finish their work, then wait for more work to be available. Some of this work seems to take longer than others, especially at the beginning.
Note the gaps between the work. In general, there seems to be more inactivity than activity during this timeframe. Ideally, we would like to see all work squished together, with no waits in between. Improvements like this should bring the total execution duration lower. In this case, total load time.
We've identified some actionable information so far, even if it only leads to investigation:
It's very common for profiling to be an iterative process. The result of a profiling session could easily be just adding more event timers, or digging deeper into how something works. Before we can expect that code change that results in a heroic 10x speedup, we need to be able to see clearly what is going on.