 |
Cesium for Unreal 2.24.1
|
 |
Cesium for Unreal 2.24.1
|
This guide will help you find performance problems in your C++ code using the CPU Usage tool included in Visual Studio's Diagnostic tools window.
The CPU Usage tool is easy to set up with minimal impact on how your app is built or how it runs. If you use Visual Studio often, you may have this running already. This is a sampling-based profiler, with pros and cons detailed here.
In this example, we will use our Cesium performance tests. Follow the steps outlined here.
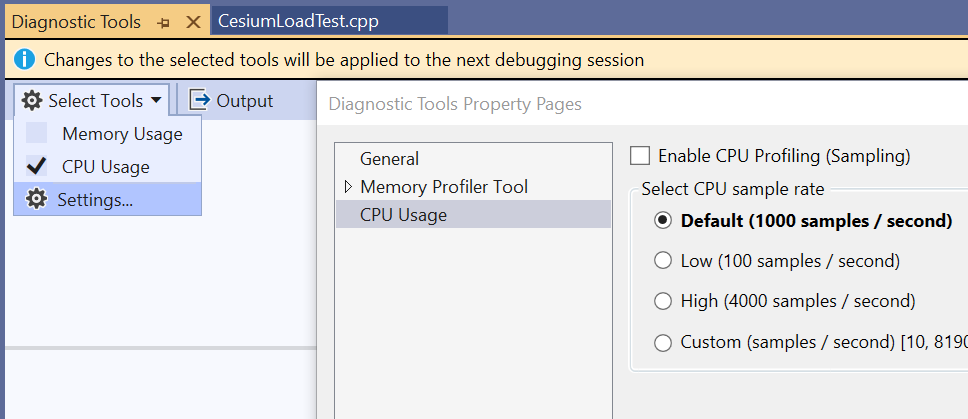
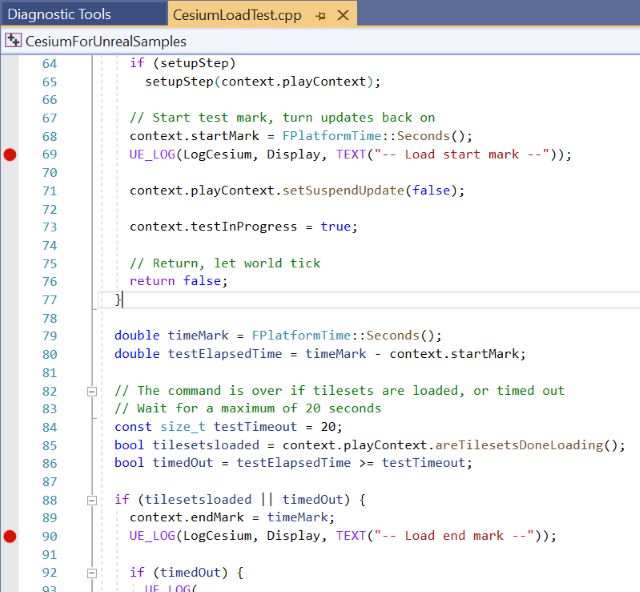
We could profile the entire debugging session if we needed to. But it's generally good practice to reduce your timing capture as much as possible. This can improve responsiveness when using resource intensive profiling tools, like memory tracking.
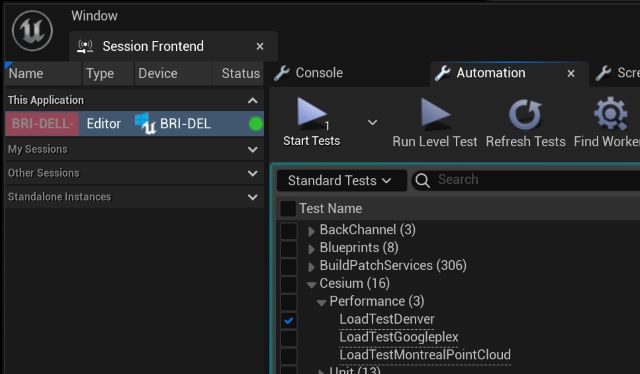
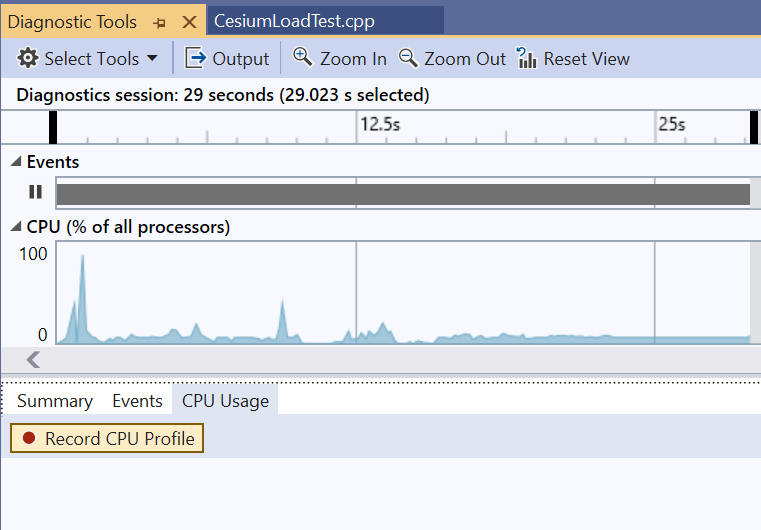
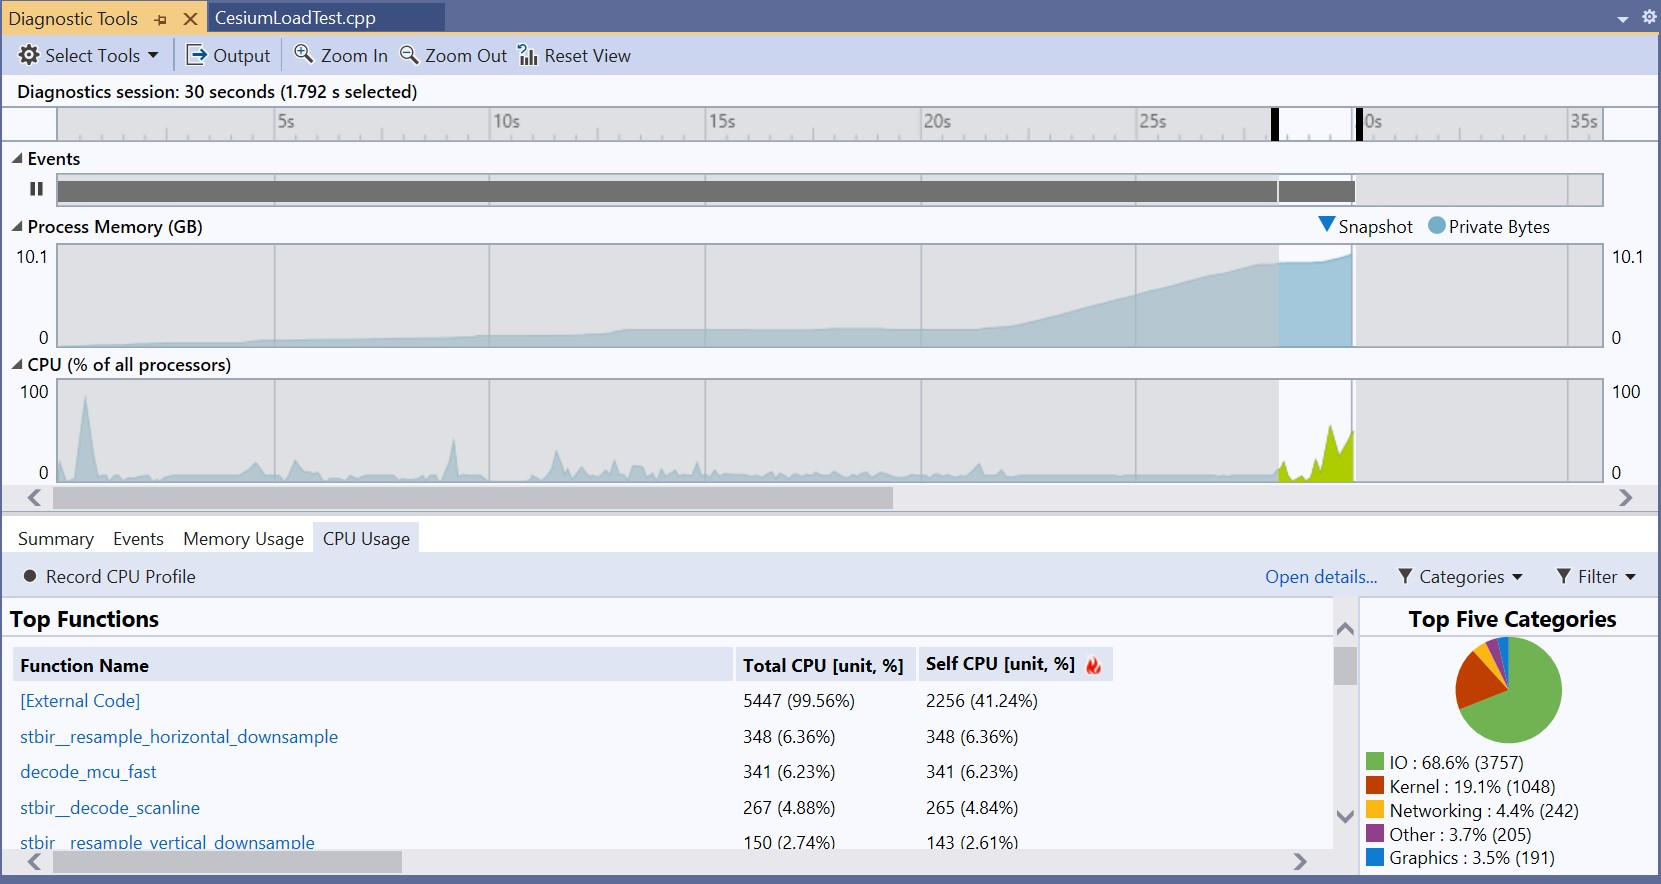
This can be a bit daunting at first, but most profiling tools have a similar workflow.

Note the highlighted area to the right where the CPU usage spikes. This corresponds to the breakpoints that we set.
All data from the report will reflect this selection only.
From the main window, click on "Open Details" 
The CPU Usage window will appear. Set "Current View" to "Functions", then find the 'Self CPU' column and sort descending (down arrow).
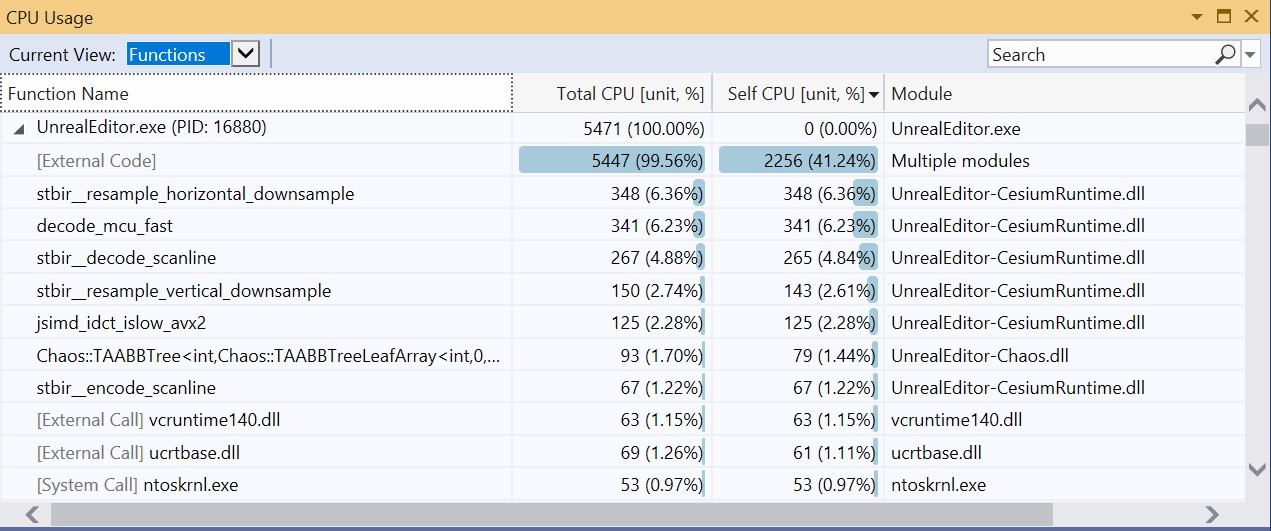
This window now shows the functions that have the highest time spent within themselves only. Useful for finding individual functions that are called often or need to be optimized.
In this example, stbir_resample_horizontal_downsample is of particular interest because it's in the code base we built. Entries with [External] or originate from an unfamiliar module are generally ignored, although it is useful to know we are calling into them.
Right click on the stbir_resample_horizontal_downsample row, select "View in Call Tree".
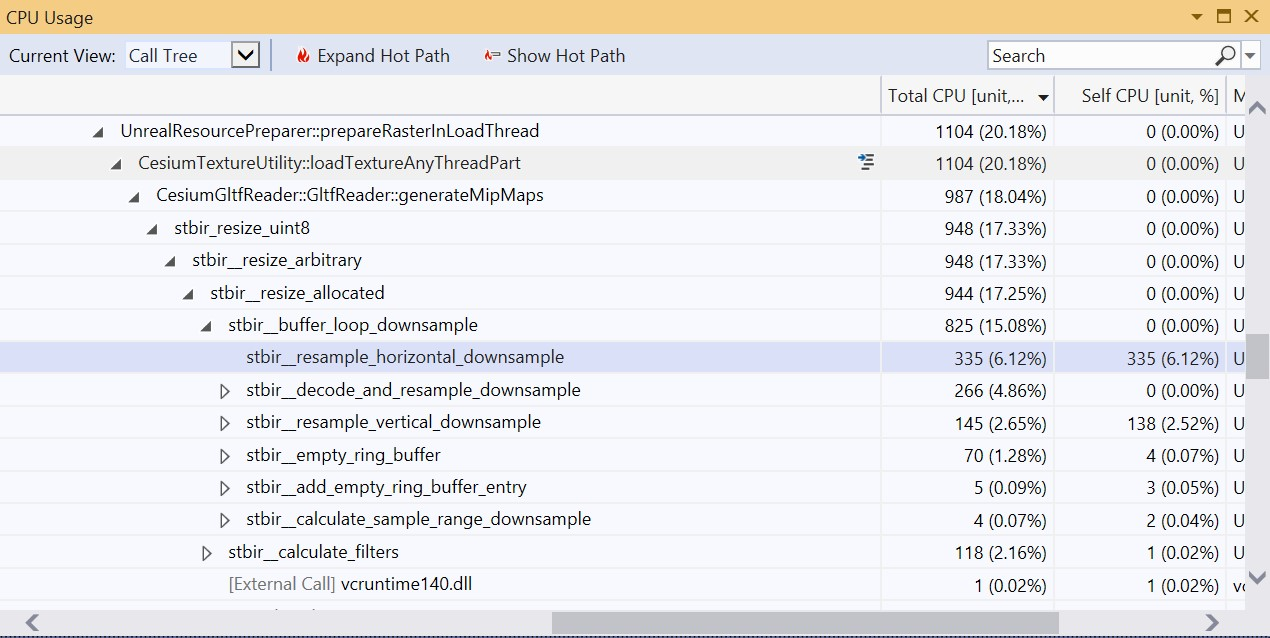
The window above is starting to show some actionable information:
CesiumTextureUtility::loadTextureAnyThreadPart. Basically, we're loading texturesstbir_XXX functions that are taking the bulk of the time, and might be candidates for optimizationstbir_resample_horizontal_downsample, but keep in mind the limits of a sampling profiler. We don't know how many times it was called, just that it was being executed ~6% of the time.Are these functions worth investigating and potentially optimizing? Maybe. Again, know this is a sampling profiler. Even if you optimize the highest cost function to 0.001%, you are only improving CPU efficiency.
If your goal is to reach absolute numbers, like specific loading times, or frames per second, you may need another type of profiling tool.